|
The global oil market is currently undergoing significant shifts, driven by geopolitical tensions, policy decisions, and evolving trade flows. Market volatility has been exacerbated by sanctions, supply chain disruptions, and changes in refining strategies, all of which are influencing price dynamics and trade patterns. This article explores the key trends shaping the oil market, from price fluctuations to macroeconomic risks and future projections.
Price Dynamics and Market Shifts: Brent-Dubai Spread and Middle Eastern Grades The Brent-Dubai crude spread has widened to its highest level since 2015, indicating heightened volatility in market fundamentals. Traditionally, Dubai crude trades at a discount to Brent, but recent panic buying by Indian and Chinese refiners has flipped this relationship. A rare premium of $2.1 per barrel for Dubai crude suggests frantic short-term demand for prompt cargoes, likely due to sanctions on Russia’s shadow fleet that have disrupted established supply chains. The market has responded with record trading volumes, as Asian refiners seek to hedge against delivery uncertainties. Shift to Non-Middle Eastern Crude Elevated Dubai crude premiums are compelling refiners to diversify their crude sources. China has significantly increased its purchases of Brazilian crude, securing 800,000 barrels per day for April to take advantage of competitive pricing for longer-haul grades. Meanwhile, India has ramped up its spot purchases of West African sweet crude, particularly from Nigeria and Angola. This strategic shift highlights refiners' adaptability to cost pressures and geopolitical disruptions. However, a growing reliance on longer-haul crude may result in higher freight costs and logistical challenges. Geopolitical and Policy Impacts: Sanctions on Russia and Their Ripple Effects The Biden administration’s sanctions targeting Russia’s shadow fleet have intensified supply chain disruptions, leading to a greater reliance on non-Russian crudes. This policy has contributed to market dislocations, particularly in Asia, as refiners seek alternative sources. Trump’s OPEC Messaging and Tariff Uncertainty Despite Brent crude prices maintaining relative stability within the $77–$79 per barrel range, downside risks remain due to weak Chinese manufacturing data and potential U.S. tariffs on Colombian oil. Trump’s proposed 25% tariff on Colombian crude—of which 41% is exported to the U.S.—poses broader implications for global oil trade, as markets will need to reallocate Colombian barrels to alternative buyers. Libyan Exports and Supply RisksPolitical unrest in Libya continues to disrupt oil exports, with ongoing protests impacting the Es Sider and Ras Lanuf ports, which have a combined capacity of 450,000 barrels per day. Any prolonged disruptions could further tighten global oil supply, particularly for Mediterranean buyers, potentially pushing Brent prices above $80 per barrel. Given the already tight supply-demand balance, any additional strain could have outsized effects on pricing. OPEC+ and Saudi Pricing StrategiesSaudi Arabia is considering raising crude prices for Asian buyers in March to the highest levels in over a year, reflecting increased demand from China and India. This move comes amid supply constraints linked to U.S. sanctions on Russia. Meanwhile, energy ministers from Saudi Arabia, Iraq, and Libya met to discuss stabilizing global energy markets ahead of the upcoming OPEC+ meeting. Market Structure and Global Benchmarks The futures market is currently in backwardation, with near-term contracts priced higher than longer-term ones. This pricing structure suggests expectations of tighter supply or increased demand in the short term. As of today, Brent crude is trading at $77.50 per barrel, while West Texas Intermediate (WTI) is at $73.51 per barrel. The narrowing Brent-WTI spread indicates a convergence in global oil prices. Major Market Movers Expansion by U.S. Oil MajorsAmerican oil giants are expanding their global footprint, with ExxonMobil initiating exploratory drilling offshore Cyprus, targeting potential reserves in the Eastern Mediterranean. ConocoPhillips’ acquisition of Malaysia’s Kebabangan cluster underscores a strategic shift towards LNG and gas exports in Asia. Meanwhile, Chevron’s Tengiz expansion in Kazakhstan aims to increase output by 25%, reflecting sustained investment in high-margin projects. This geographic diversification underscores the strategic efforts of U.S. companies to bolster their presence in growth regions. Saudi Aramco’s Strategic Moves Saudi Aramco has made its first purchase of WTI Midland crude, a U.S. oil grade essential to the global Brent benchmark. This marks Aramco’s entry into this key market segment, further diversifying its crude sourcing strategy. Chinese Refiners Face Shutdowns A combination of soaring Middle Eastern crude premiums and tripled tariffs on fuel oil has forced at least four Chinese independent refiners, known as teapots, to halt operations. This development signals weak downstream margins and is further compounded by China’s sluggish manufacturing recovery. Macro Trends and Risks Demand Uncertainty in AsiaAlthough Asian refiners have been aggressively buying prompt cargoes, weak economic indicators from China raise concerns about long-term demand growth. As Asia remains the primary driver of global oil consumption, any sustained decline in demand could have far-reaching implications for the broader market. U.S. Supply Resilience Despite global uncertainties, the U.S. oil sector remains robust, bolstered by aggressive investments from ExxonMobil, ConocoPhillips, and Chevron. This resilience positions the U.S. as a key player in stabilizing market fluctuations and capturing greater market share amid geopolitical instability. Geopolitical Disruptions Fires at Iraq’s Rumaila field, which resulted in a loss of 300,000 barrels per day, alongside continued instability in Libya, underscore the precarious nature of Middle Eastern supply. Meanwhile, the European Union’s easing of sanctions on Syria could allow Syrian crude to reenter global markets, though this prospect remains contingent on political stability. Technical and Market Sentiment Analysis Short-term price movements suggest slight upward trends for both Brent and WTI. However, the Average Directional Index (ADX) points to weak trend strength, indicating potential consolidation. Momentum indicators present mixed signals, with RSI remaining neutral and MACD showing a bearish crossover. Market sentiment remains cautiously optimistic, with short-term uncertainties but longer-term bullish trends driven by structural supply limitations and recovering global demand. Conclusion The oil market remains a complex landscape shaped by geopolitical tensions, shifting trade patterns, and evolving refining strategies. While Brent prices have remained stable, underlying volatility suggests that any additional supply disruptions could lead to significant price swings. Market participants will closely monitor developments in Libya, U.S. tariff policies, and Asian refining trends to anticipate the next market movements. The ongoing diversification of crude sourcing reflects a fundamental change in global trade flows, with Brazil, West Africa, and U.S. crude grades playing increasingly prominent roles in the coming years.
0 Comments
The gold market is a cornerstone of global finance, serving as a hedge against economic uncertainty, inflation, and currency fluctuations. For traders and hedge fund managers, understanding the fundamental factors that drive the gold market is crucial for developing informed trading strategies and making sound investment decisions.  This article delves into the key supply and demand dynamics, economic indicators, geopolitical influences, and market sentiment that shape the gold market. Supply and Demand DynamicsSupply Factors : The supply of gold primarily comes from mining production and recycling. Major gold-producing countries include China, Australia, Russia, and the United States. The discovery of new mines and advancements in mining technology can impact the overall supply. Additionally, recycled gold from old jewelry, electronics, and other sources contributes significantly to the market. Central banks also play a crucial role by buying and selling gold reserves, influencing overall supply and demand. Demand Factors: Jewelry demand, especially in culturally significant markets like India and China, remains a major driver of gold consumption. Investment demand, driven by economic uncertainty, inflation fears, and market volatility, sees investors turning to gold as a safe-haven asset. Gold is also essential in various industrial applications, particularly in electronics due to its superior conductive properties. Economic Indicators and ConditionsInflation and Interest Rates: Gold is widely regarded as a hedge against inflation. When inflation rates rise, the purchasing power of fiat currencies declines, leading investors to seek refuge in gold. Conversely, interest rates have an inverse relationship with gold prices. Lower interest rates reduce the opportunity cost of holding non-yielding assets like gold, making it more attractive. Currency Fluctuations: The strength of the US dollar significantly impacts gold prices, as gold is typically priced in dollars. A weaker dollar makes gold cheaper for foreign buyers, increasing demand, while a stronger dollar has the opposite effect. Geopolitical FactorsPolitical Uncertainty and Tensions: Political instability, elections, conflicts, and changes in government policies can lead to increased demand for gold. During times of geopolitical tension, such as wars or terrorist activities, investors flock to gold as a safe-haven asset, driving up prices. We've seen this at work earlier in 2024 with the geo-political tensions in the Middle East. Market Sentiment and SpeculationInvestor Behavior: The attitudes and behaviors of investors significantly influence gold prices. Positive sentiment towards gold can drive prices up, while negative sentiment can lead to a sell-off. Speculative activities in the futures and options markets also contribute to short-term price volatility. Central Bank PoliciesMonetary Policy: Central banks' monetary policies, particularly those related to interest rates and money supply, have substantial effects on gold prices. Expansionary monetary policy, characterized by low-interest rates and increased money supply, often leads to higher gold prices. Gold Reserves Management: Decisions by central banks to increase or decrease their gold reserves can signal their confidence in gold as a monetary asset, influencing its demand and price. Global Economic HealthEconomic Growth and Recession: During periods of robust economic growth, investment demand for gold may decrease as investors seek higher returns in equity markets. Conversely, during economic downturns, gold demand typically increases as investors look for stability and wealth preservation. Technological AdvancementsMining Technology: Advancements in mining technology can make gold extraction more efficient and cost-effective, potentially increasing supply. Innovations in industrial uses of gold, such as in electronics and medical devices, can also drive demand. Regulatory ChangesMining and Financial Regulations: hanges in environmental and mining regulations can impact the cost and feasibility of gold mining operations. Financial market regulations affecting derivatives and ETFs can also influence gold trading. Market Liquidity and AccessibilityMarket Access and Liquidity: The ease with which investors can buy and sell gold, including through online platforms and financial products like ETFs, can influence demand. Overall market liquidity, meaning the ability to quickly and easily trade gold without affecting its price, plays a crucial role in its attractiveness as an investment. ConclusionFor traders and hedge fund managers, a comprehensive understanding of the fundamental factors that drive the gold market is essential. By analyzing supply and demand dynamics, economic indicators, geopolitical influences, market sentiment, central bank policies, and technological advancements, investors can develop more informed and strategic approaches to trading gold. In a market characterized by volatility and uncertainty, staying attuned to these fundamental factors can provide a critical edge in navigating the complexities of the gold market. In the intricate world of copper trading, the "Yangshan Copper Premium" stands as a pivotal indicator, offering crucial insights into the dynamics of Chinese copper imports. Named after the bustling Yangshan port in Shanghai, where a substantial portion of China's copper imports is funneled, this premium captures the additional cost incurred by Chinese buyers for imported copper, juxtaposed against prevailing global exchange prices, notably those on the London Metal Exchange (LME).  Rooted in the intricate interplay of supply and demand dynamics, shipping logistics, import tariffs, inventory levels, and prevailing market sentiment, this premium serves as a barometer for the vigor of Chinese copper demand, import trends, and the broader market landscape. Let's delve deeper into its significance for analysts and traders seeking to navigate the complexities of the copper market. This premium is influenced by various factors, including supply and demand dynamics in the Chinese market, shipping costs, import duties, inventory levels, and market sentiment. Traders and analysts closely monitor changes in the Yangshan copper premium as it provides insights into the strength of Chinese copper demand, import trends, and market conditions. Lets take a closer look. If the Yangshan copper premium sinks to zero or approaches zero, it typically indicates a few significant developments in the copper market and Chinese economy: Weakened Demand: A zero or near-zero premium suggests subdued demand for imported copper in China. This could be due to various factors such as slower economic growth, reduced industrial activity, or weaker demand from key sectors like construction and manufacturing. A lack of premium indicates that Chinese buyers are not willing to pay a premium for imported copper over the prevailing global exchange prices. Market Oversupply: When the premium on imported copper disappears, it may suggest an oversupply situation in the Chinese market. This oversupply could result from increased domestic production, higher inventory levels, or reduced consumption. A surplus of copper in the market can lead to downward pressure on prices as sellers compete to offload excess supply. Currency Effects: Changes in currency exchange rates, particularly fluctuations in the value of the Chinese yuan (CNY) relative to other currencies, can also impact the Yangshan copper premium. A strengthening yuan or weakening of other currencies may reduce the cost of importing copper, narrowing or eliminating the premium. Global Market Dynamics: The disappearance of the Yangshan copper premium can also reflect broader trends in the global copper market. Changes in international supply and demand, trade policies, geopolitical developments, and macroeconomic factors can all influence the premium paid on Chinese copper imports. Overall, a sinking Yangshan copper premium signals weaker demand, market oversupply, or changes in currency dynamics, providing valuable insights into the state of the Chinese copper market and broader economic conditions. Traders, analysts, and policymakers closely monitor changes in the premium as part of their assessment of copper market fundamentals and price trends. The Yangshan Copper Premium has extended a months-long decline to reach zero for the first time in Shanghai Metals Market data going back to 2017. The unusually low levels come just days after copper on the London Metal Exchange rallied to a two-year high near $10,000 a ton. 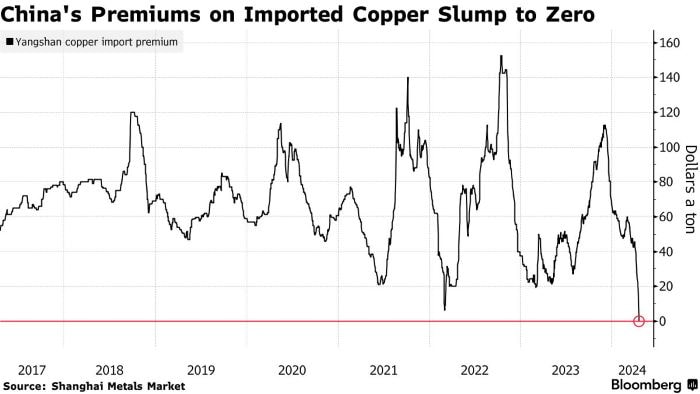
We know that if the Yangshan copper premium sinks to zero or approaches zero, it typically indicates a few significant developments in the copper market and Chinese economy such as extremely weak demand for imported cargoes or it may suggest an oversupply situation in the Chinese market. Copper is up nearly 15% this year on the LME driven by fund speculation, according to the CoT positioning data. Is this surge in price action based on the narratives of global recovery in manufacturing and growth in demand from new-energy applications driving demand? Your guess is as good as mine on that one! However, the fact remains that in China, inventories are rising, spot prices are trading at a discount to futures, and smelters are turning to exports. This tells us that the Chinese copper market is oversupplied and experiencing weaker demand. Conclusion The Yangshan Copper Premium, once a steadfast gauge of Chinese copper import vitality, has taken an unprecedented plunge, reaching zero for the first time in recent history. This development occurs amidst a backdrop of soaring copper prices on the London Metal Exchange, propelled by speculative fervor and optimistic narratives of global economic resurgence and burgeoning demand from green energy sectors. Yet, beneath the surface, the Chinese copper market tells a starkly different story—a tale of rising inventories, tepid spot prices, and smelters seeking solace in export avenues. As the age-old adage goes, "the cure for high prices is high prices," and in China's copper realm, this rings truer than ever. With demand flagging amidst soaring prices, the once-booming appetite for copper is dwindling, casting shadows over the copper market's trajectory. For traders and analysts, attuned to the nuanced dance of supply and demand, this downturn in the Yangshan Copper Premium signals a cautionary tale, a harbinger of challenges and opportunities lurking in the ever-evolving landscape of copper trading. As the copper market continues to captivate investors, the recent surge in copper prices has sparked discussions among traders and hedge fund managers about whether the rally has extended beyond reasonable bounds. In this artcicle, we delve into the dynamics shaping the copper market and present a compelling case for a potential downward correction in prices. Copper's Remarkable Run Over the past month, copper prices, particularly on the London Metal Exchange (LME), have witnessed a remarkable ascent, breaching the $10,000 per ton mark for the first time in two years and COMEX copper rallying to over $7.60 per ounce in recent days. This has been underpinned by concerns surrounding tight global mine supply and heightened demand from the burgeoning green energy sector. While the long-term outlook for copper remains bullish, short-term indicators suggest that a correction may be on the horizon. Several factors contribute to this assessment: China's Property Market Woes Despite resilient manufacturing activity in China driven by overseas demand and technological advancements, the ongoing crisis in China's property market continues to cast a shadow. Housing completions, a key gauge of copper demand, have witnessed a significant decline year-on-year, signaling a slowdown in demand for the red metal. Elevated Copper Inventories in China Copper inventories in China have surged to seasonally high levels, dampening expectations for a traditional second-quarter surge in demand. High refined copper output, coupled with tepid domestic demand, has led to a buildup in stocks, prompting smelters to export refined copper to overseas markets. Record Refined Copper Output in China Despite spot treatment charges dipping below zero, Chinese smelters have shown no signs of scaling back production. Refined copper output in China has surged to near all-time highs, driven by the country's strategic emphasis on green energy initiatives. China's Premium on Imported Copper Slumps The premium on imported copper in China has plummeted to zero, reflecting subdued buying interest amid soaring international copper prices. This decline in premium underscores the cooling appetite for imported copper in the Chinese market. US Monetary Policy Considerations Beyond China, the trajectory of US monetary policy looms large over copper prices. Elevated interest rates and a strengthening dollar have historically exerted downward pressure on industrial metals. Expectations of a delayed Fed rate cut could further bolster the US dollar and dampen investor sentiment, potentially leading to lower copper prices. Positioning: A Crowded Market We've got extreme positionining across the board in the copper market. Commercials are at an extreme net short. Large specs are at an extreme net long as are the small specs now. Now this condition could continue for a while longer and certianly doesn't mean we should sell this market. We could even see new highs over the next few weeks. However, what it does tell us, is is that the risk/reward ratio at these levels is not good. Futures Spreads We have seen the COMEX nearby futres contract go into backwardation over the next month out, which does suggest tightening supplies as the nearby contract is bid. However, it is a very small premium currently, but nonetheless, we need to pay attention to this over the next few weeks. 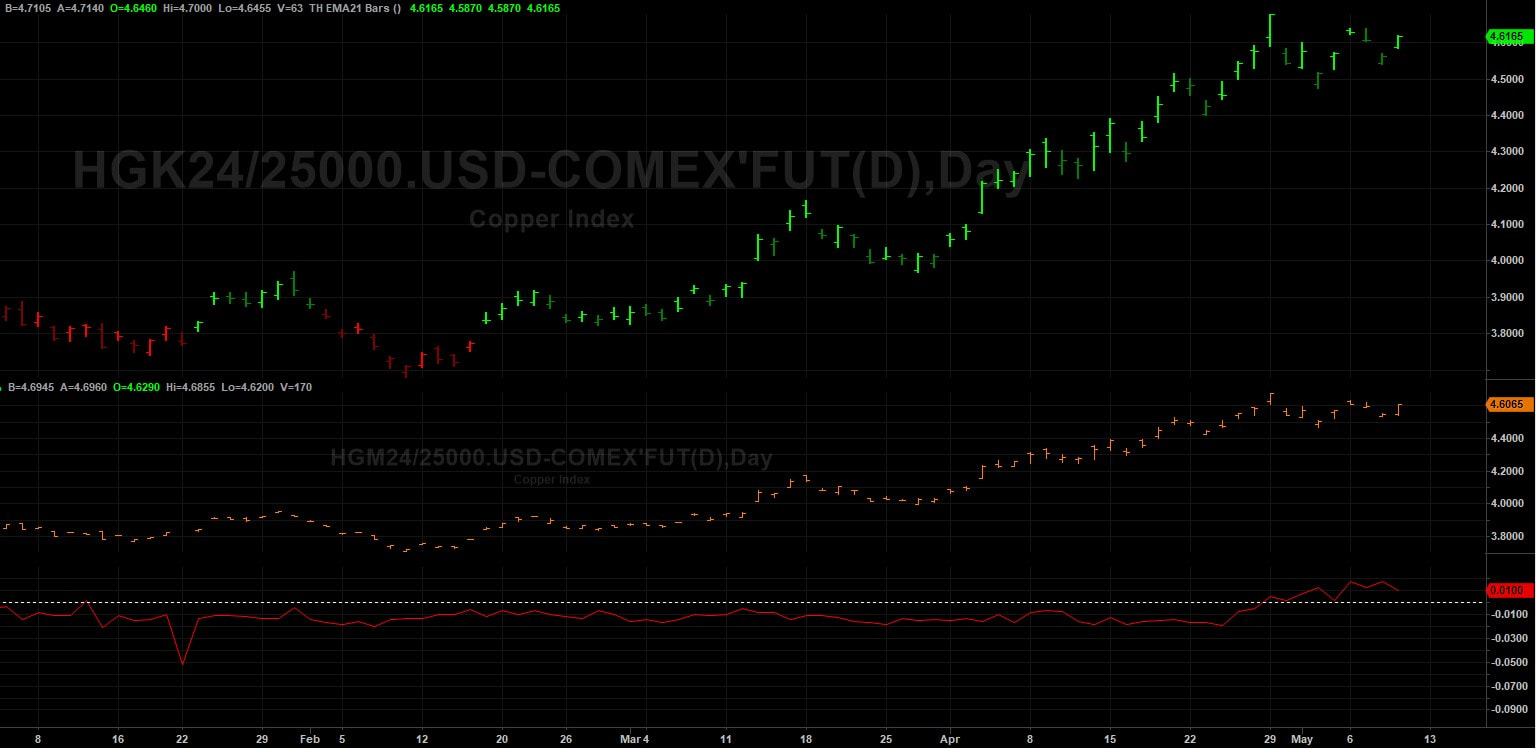 Seasonal Tendencies The seasonal tendency for May is down. Now I wouldn't use seasonals on their own. They are just tendencies and can be overridden by fundamentals. However, when used in combination with other factors such positioning and spreads, they can be very useful for confirmation. 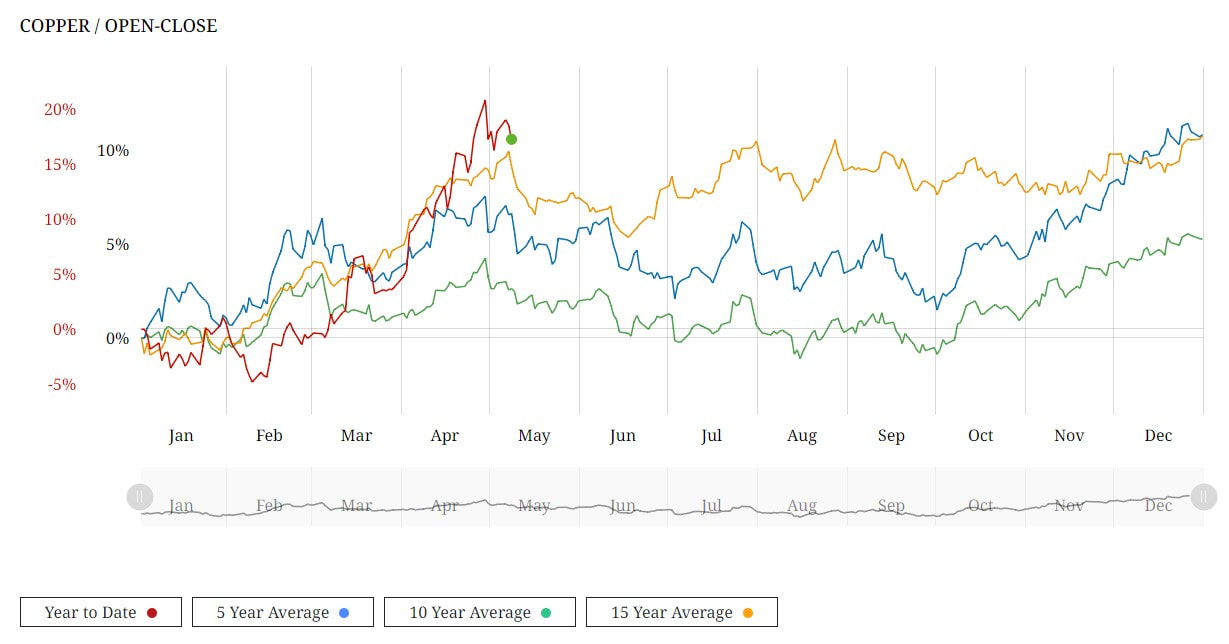 In conclusion, while the long-term fundamentals supporting copper remain intact, short-term headwinds suggest a corrective phase may be in the making. I'm certainly monitoring the fundamentals, positioning, seasonals, spreads and technicals over the next few weeks before jumping into this market.
The Impact of Extreme Weather and Disease Outbreak At the heart of the cocoa crisis lie fundamental factors exerting profound influence on market dynamics. Key among these are adverse weather conditions and disease outbreaks in West Africa, which have severely impacted cocoa production. Agriculture in this region is particularly susceptible to the warm phase of the El Niño Southern Oscillation (ENSO) cycle, which often results in drier and warmer climates. Recent months have witnessed intense heatwaves and drought, exacerbating the challenges faced by cocoa farmers. However, such conditions are typical during El Niño years, and its not solely the temperatures that are of concern but also the extremes in rainfall, which have triggered outbreaks of diseases. Late last year, West Africa experienced excessive rainfall, leading to a surge in "Black pod disease," a fungal infection that typically follows the wet season and can decimate entire cocoa harvests if left untreated. Although copper-based fungicides offer some control over the disease, their accessibility and affordability for farmers remain limited. Following the period of heavy rain, West Africa encountered unusually dry conditions, facilitating the spread of the "Swollen shoot virus." This virus, unique to the region, is transmitted by mealybugs and results in significant yield losses of up to 25% in the first year of infection and 50% in the second. Despite decades of efforts, including extensive tree removal, eradication of the virus remains a formidable challenge. The International Cocoa Organization and industry experts predict a substantial decline in global cocoa production, estimated at around half a million tonnes this year, constituting approximately 10% of the world's typical harvest. This forecast follows two consecutive years of deficit, signaling a significant shortfall in cocoa supplies. The Ivory Coast and Ghana collectively account for nearly 60% of global cocoa production. The Impact of Illegal Gold Mining Operations Cocoa production faces additional challenges beyond the impact of El Niño and extreme weather conditions. In West Africa, illegal gold mining operations have encroached upon vast swaths of fertile cocoa land in Ghana, leading to the destruction of vegetation and ecosystems. These operations can occupy large areas of land that were previously used for cocoa cultivation, displacing farmers and disrupting agricultural activities. For cocoa farmers whose land is taken over by illegal mining operations, the consequences can be devastating. Many farmers rely on cocoa cultivation as their primary source of income, and the loss of land deprives them of their livelihoods. Additionally, the environmental damage caused by mining can render the land unsuitable for future agricultural use. Technical Triggers and Regulatory Interventions
The recent gyrations in cocoa prices underscore the potency of technical triggers amplified by record low liquidity. Despite a near-tripling in cocoa futures earlier in the year, subsequent losses exceeding 20% within a single week highlight the susceptibility of the market to speculative forces. The emergence of algorithmic funds, coupled with the retreat of traditional players like hedge funds, further exacerbates price volatility, as observed in the recent fluctuations in July London cocoa futures. Regulatory interventions, exemplified by the ICE exchange's decision to increase initial margins on cocoa futures, have introduced additional complexities into the trading landscape. While intended to mitigate risk, such measures have inadvertently contributed to a contraction in liquidity, intensifying margin pressures and amplifying the risk of large variation margin calls for market participants. Navigating the Cocoa Crisis In the face of mounting challenges, traders and hedge funds are tasked with devising strategies that reconcile technical insights with a nuanced understanding of fundamental market dynamics. This demands a holistic approach that integrates comprehensive insights into crop developments, regulatory shifts, and evolving market sentiments. Adapting to the evolving landscape necessitates not only technical acumen but also a deep appreciation of the underlying fundamentals shaping cocoa price dynamics. Market participants must remain vigilant, leveraging a multifaceted understanding of the cocoa market to identify opportunities amidst the prevailing uncertainties. Conclusion As the cocoa crisis deepens, traders and hedge funds confront a formidable challenge that demands agility, foresight, and adaptability. By navigating the complexities of technical triggers, regulatory interventions, and fundamental market dynamics, market participants can position themselves to capitalize on emerging opportunities while mitigating risks effectively. In harnessing the synergies between technical expertise and fundamental insights, traders and hedge funds can navigate the cocoa crisis with resilience and proficiency, safeguarding their interests and capitalizing on market opportunities amidst the prevailing uncertainties.
From the Red Sea to the Gulf of Aden, tensions simmer, and the latest focal point of concern is the strategically vital Strait of Hormuz. With over 80% of global goods transported via sea routes, any disruption in these maritime passages sends ripples across the world economy. As we delve into the dynamics of these chokepoints, the stakes become starkly evident. The Strait of Hormuz: A Crucial Artery of Global Trade At the heart of maritime trade lies the Strait of Hormuz, a narrow passage connecting the Persian Gulf with the Gulf of Oman. This vital waterway serves as a conduit for a significant portion of the world's oil and liquefied natural gas (LNG) transportation. With approximately 20% of global crude and refined product consumption passing through its waters, any disruption here reverberates globally. Nations like Saudi Arabia, Iraq, UAE, Kuwait, Iran, and Qatar heavily rely on this route for their oil exports, making them vulnerable to any attempt to block or disrupt the flow. Furthermore, Qatar's substantial LNG exports underscore the strait's growing importance in the energy landscape. Escalating Tensions and Implications The Strait of Hormuz stands at the crossroads of geopolitical tensions, with recent events exacerbating concerns over its security. Incidents such as the seizure of the MSC Aires container vessel by Iranian forces serve as ominous reminders of the risks involved. As tensions escalate, the specter of supply disruptions looms large, with potential ramifications for global oil prices. Already, the market reflects a significant risk premium, underscoring the gravity of the situation. The consequences of any escalation extend beyond the Middle East, with Asian markets particularly susceptible to supply cuts. Global Shipping Chokepoints: A Nexus of Risks While the spotlight often falls on the Strait of Hormuz, other maritime chokepoints face their own set of challenges. From the Strait of Bab el-Mandeb to the Suez Canal and the Panama Canal, disruptions abound, affecting trade flows and economic stability. Attacks by Houthi rebels in the Red Sea, coupled with environmental factors like droughts, further compound these challenges. As geopolitical tensions escalate, trade routes become increasingly politicized, amplifying risks for seafarers and cargo alike. Exploring the SonicShares™ Global Shipping ETF (BOAT) Let's dive into an in-depth analysis of the ETF that offers direct exposure to the bustling global maritime shipping industry. BOAT stands as an indexed ETF designed to mirror the performance of the Solactive Global Shipping Index, aiming to deliver results that align with this benchmark before accounting for fees and expenses. This index comprises a diverse array of global shipping companies engaged in transporting goods and raw materials across the world's oceans, encompassing a wide spectrum of cargo ranging from consumer and industrial products to vehicles, dry bulk, crude oil, and liquefied natural gas. Chart Analysis: BOAT ETF Performance Examining the chart below, which tracks the trajectory of the BOAT ETF, we observe a notable breakout from the recent downtrend, now rallying to new highs. At present, the BOAT ETF comprises 47 global shipping companies. However, we only need to focus on the top 15 weighted holdings within this ETF, as they wield the greatest influence on its overall performance. Our analysis seeks to answer which companies driving the ETF's trajectory and identifying the out performers that will ultimatly go onto our watchllist. 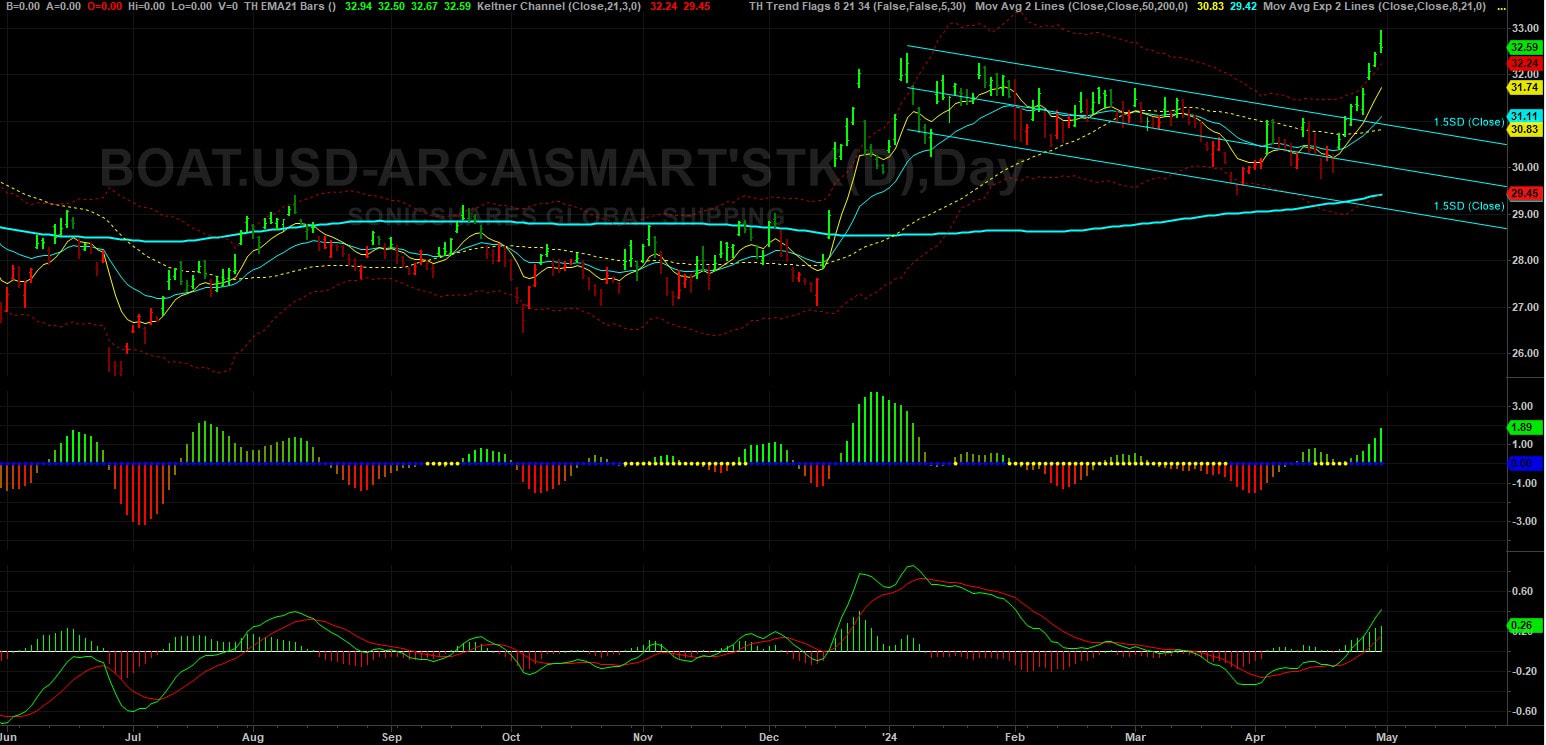 BOAT ETF Identifying Outperformers in the BOAT ETF Analyzing the chart depiction below, we pinpoint several shipping companies within the BOAT ETF that exhibit robust performance, as evidenced by discernible uptrends in their price action. Notably, Golden Ocean Group (GOGL) and Stolt-Nielsen Limited (SNI) emerge as relative outperformers within the ETF, boasting well-defined uptrends that underscore their resilience and market strength. These companies are on our watchlist, but it is not time to enter a trade yet. This is where technical tools can be used to time our entry into these markets. We'll be waiting for a reversion to the mean before we go long. 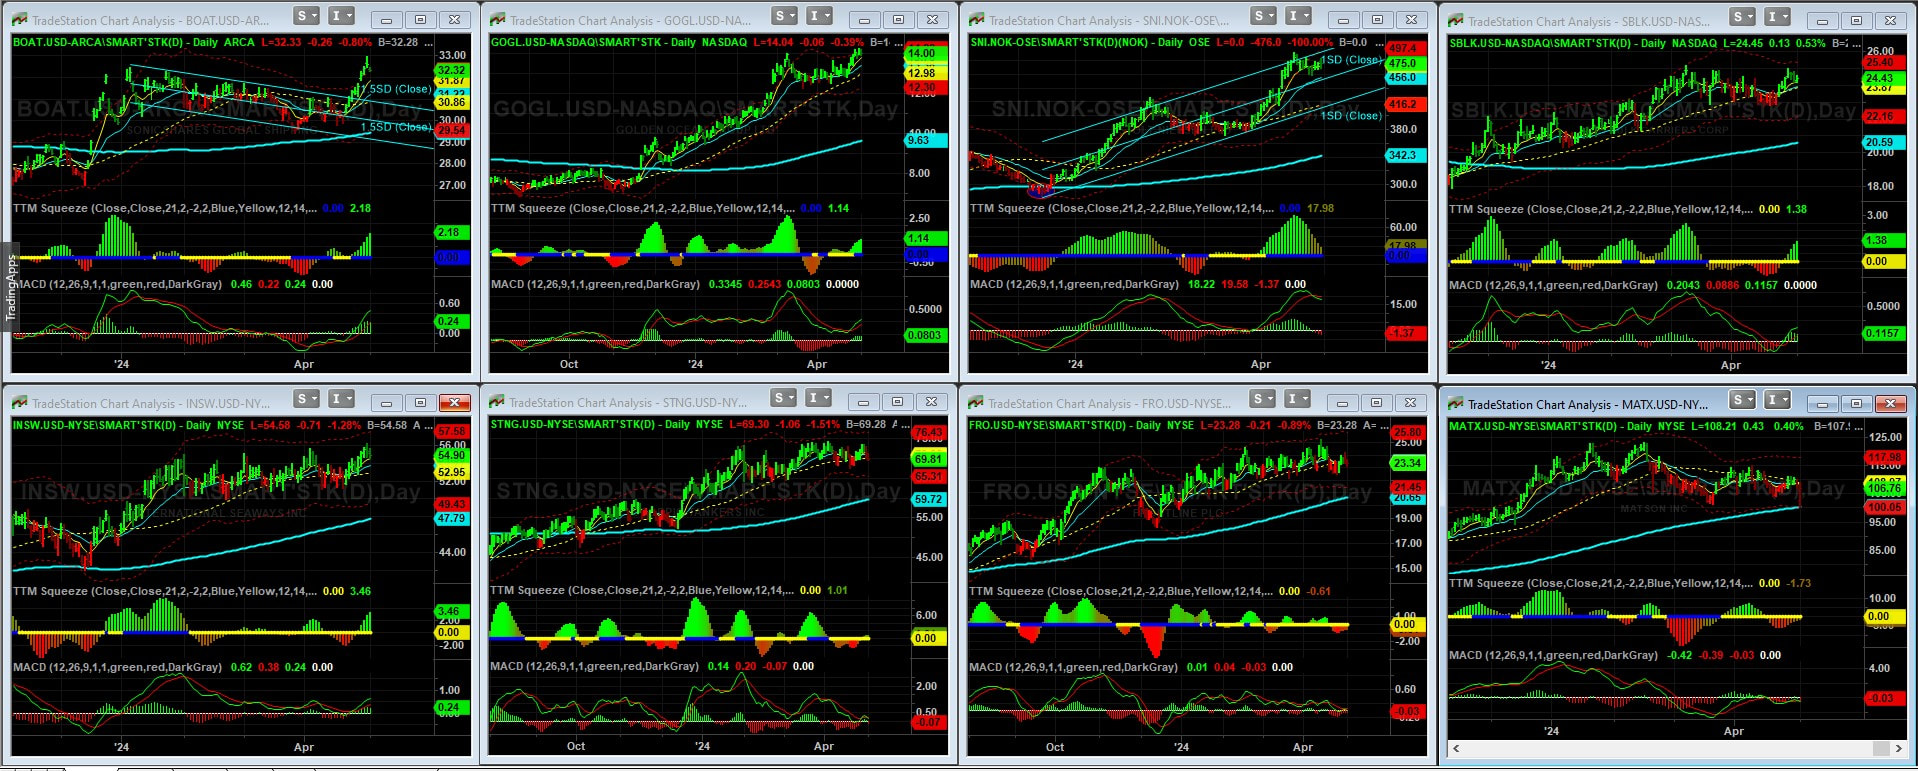 Outperformers in the BOAT ETF Conclusion: Navigating Opportunities Amidst Geopolitical Uncertainty
For traders navigating the tumultuous seas of the global shipping market, the recent developments underscore both challenges and opportunities. As geopolitical tensions escalate, maritime chokepoints become focal points of concern, potentially disrupting supply chains and impacting market dynamics. Yet, amidst these uncertainties lie opportunities for astute traders to capitalize on shifting trends and emerging patterns. The recent attention on the Strait of Hormuz highlights the critical importance of monitoring geopolitical developments and their potential ramifications on shipping routes and trade flows. As traders, vigilance is paramount, and strategic positioning can help navigate the complexities of geopolitical risk while seizing opportunities for profit. In this ever-evolving landscape, staying informed and adaptable is key. By closely tracking the performance of key shipping companies within ETFs like BOAT, traders can identify outperformers and leverage their insights to make informed investment decisions. Golden Ocean Group (GOGL) and Stolt-Nielsen Limited (SNI), among others, stand out as promising entities with strong uptrends, presenting compelling opportunities for traders seeking to capitalize on market momentum. As we chart our course through uncertain waters, we need to remain vigilant, strategic, and agile. By harnessing our understanding of geopolitical dynamics and market trends, we can navigate the challenges ahead and steer towards profitable horizons in the dynamic world of global shipping trading.
Masato Kanda, a top Japanese currency official, declined to confirm any intervention when questioned, stating, “No comment for now.” However, the market movements exhibit typical signs of intervention, such as the 160.0 threshold, a surge in trading volume, and the magnitude of the move. The thin liquidity conditions on a Monday morning, coupled with a Japanese public holiday, may have exacerbated the yen's spike. These developments echo those of September 22, 2022, when Japan intervened with approximately $20 billion to bolster the yen. If history repeats, the USD/JPY pair could end up trading around 156.50 by the end of the day.
Market observers are closely monitoring Japanese officials for further insights. Confirmation of intervention and indications of a sustained campaign rather than a one-off move are particularly sought after. The tendency to test officials' tolerance by selling rallies has been observed in past interventions, although reluctance to push the pair too close to 160.0 again is evident from the September 2022 experience. Additionally, with a week filled with significant US events, including a potentially hawkish Fed and strong economic data, the yen could face renewed pressure. In Monday's early American session, USD/JPY found temporary support near 155.00 following a steep decline from its historic highs of 160.00, which market participants attributed to suspected Japanese intervention. Despite speculation, Masato Kanda refrained from confirming any FX intervention during his speech in the European session. However, he emphasized the negative impact of speculative and rapid FX movements on the economy. Expectations of further intervention remain high as the Japanese yen continues to weaken. The Bank of Japan's shift towards monetary policy tightening after a prolonged period of ultra-easy monetary policy has not provided firm support for the yen. Concerns persist regarding the limited scope for policy tightening due to uncertainties surrounding wage growth. While the BoJ moves cautiously towards policy normalization, expectations of sustained policy divergence between the BoJ and the Federal Reserve hinder the yen's stabilization.
Crude Oil and Gasoline Inventories: A Closer Look The United States witnessed a notable decline in crude oil inventories, with a reduction of 3.23 million barrels reported by the American Petroleum Institute (API) for the week ending April 19. This came as a surprise to analysts who had anticipated a build of 1.8 million barrels. Additionally, the Department of Energy (DoE) reported an increase in inventories within the Strategic Petroleum Reserve (SPR), reaching 365.7 million barrels—the highest level since last April. Market Reaction and Price Trends The news of declining crude oil inventories sparked a bullish sentiment in the market, leading to an uptick in oil prices. This optimism was further fueled by a weakening U.S. dollar index and concerns over sluggish business activity. However, despite these inventory fluctuations, prices have yet to surpass the critical $90 per barrel mark. Factors Driving Price Volatility Several factors have contributed to the recent volatility in oil prices. Geopolitical tensions in the Middle East, particularly the escalating conflict between Israel and its neighbors, have raised concerns about potential disruptions to oil supply routes. Furthermore, macroeconomic indicators such as U.S. inflation data have added to market uncertainty, influencing investor sentiment and price dynamics. Bullish Catalysts and Market Outlook Despite these challenges, oil prices are poised for a weekly gain, driven by a combination of inventory declines, a slowdown in U.S. manufacturing, and ongoing geopolitical tensions. However, concerns persist regarding the sustainability of this upward trajectory, as economic headwinds and supply-side risks continue to loom over the market. Positioning The CoT data shows Funds and Commercials at an extreme level so this warrants caution moving forward. Clearly, this condition can persist for some time but it also opens up the risk of fund liquidation if or when price action move towards 3 standard deviations from the mean. 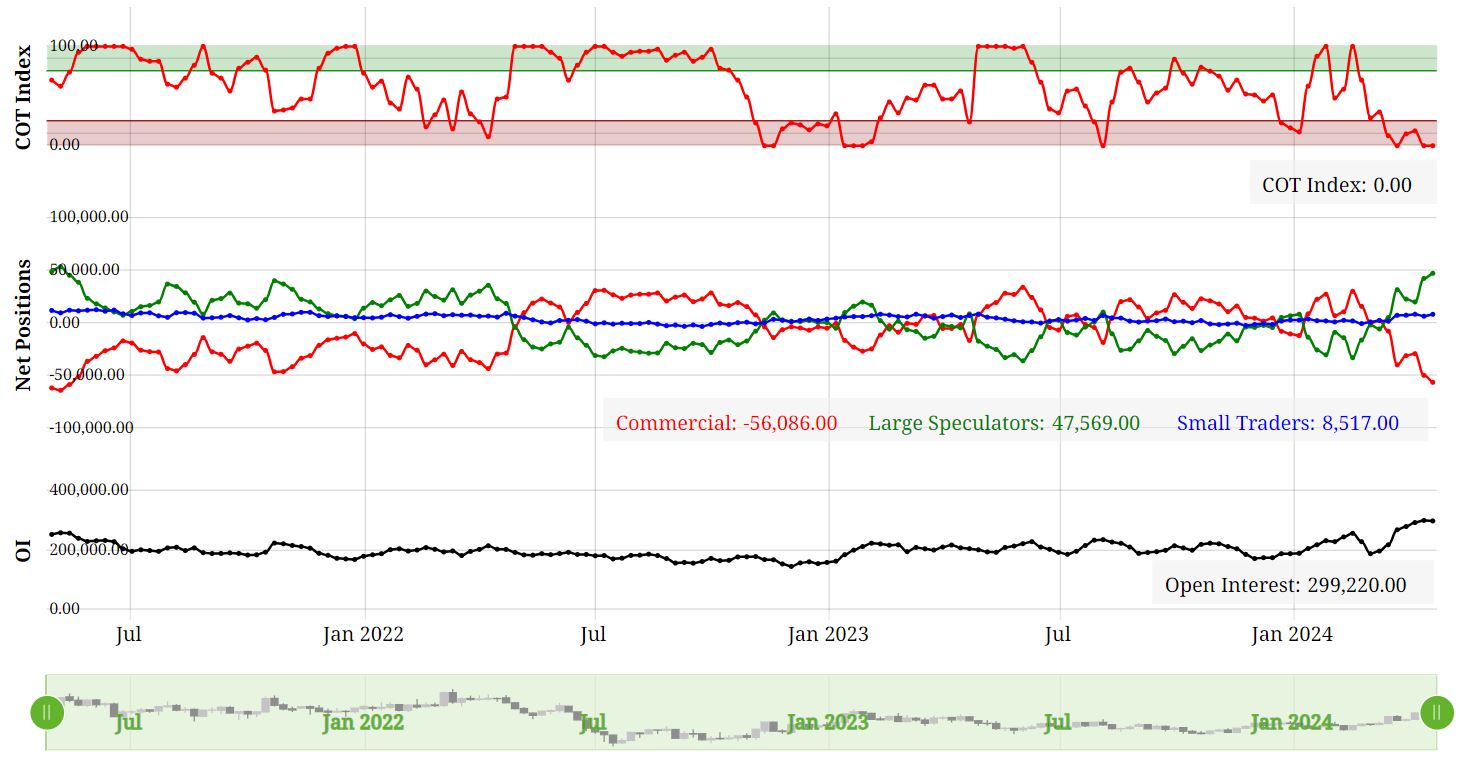 Futures Contract Spreads The inter-contract futures spread in WTI crude oil is currently in backwardation. In other words, the nearby is at premium to the next contract out and this has been increasing over the last few months. It's not a significant premium at this stage, but one to keep on the watchlist. Any escalation in the geo-political situation in the middle-east could drive this premium further. 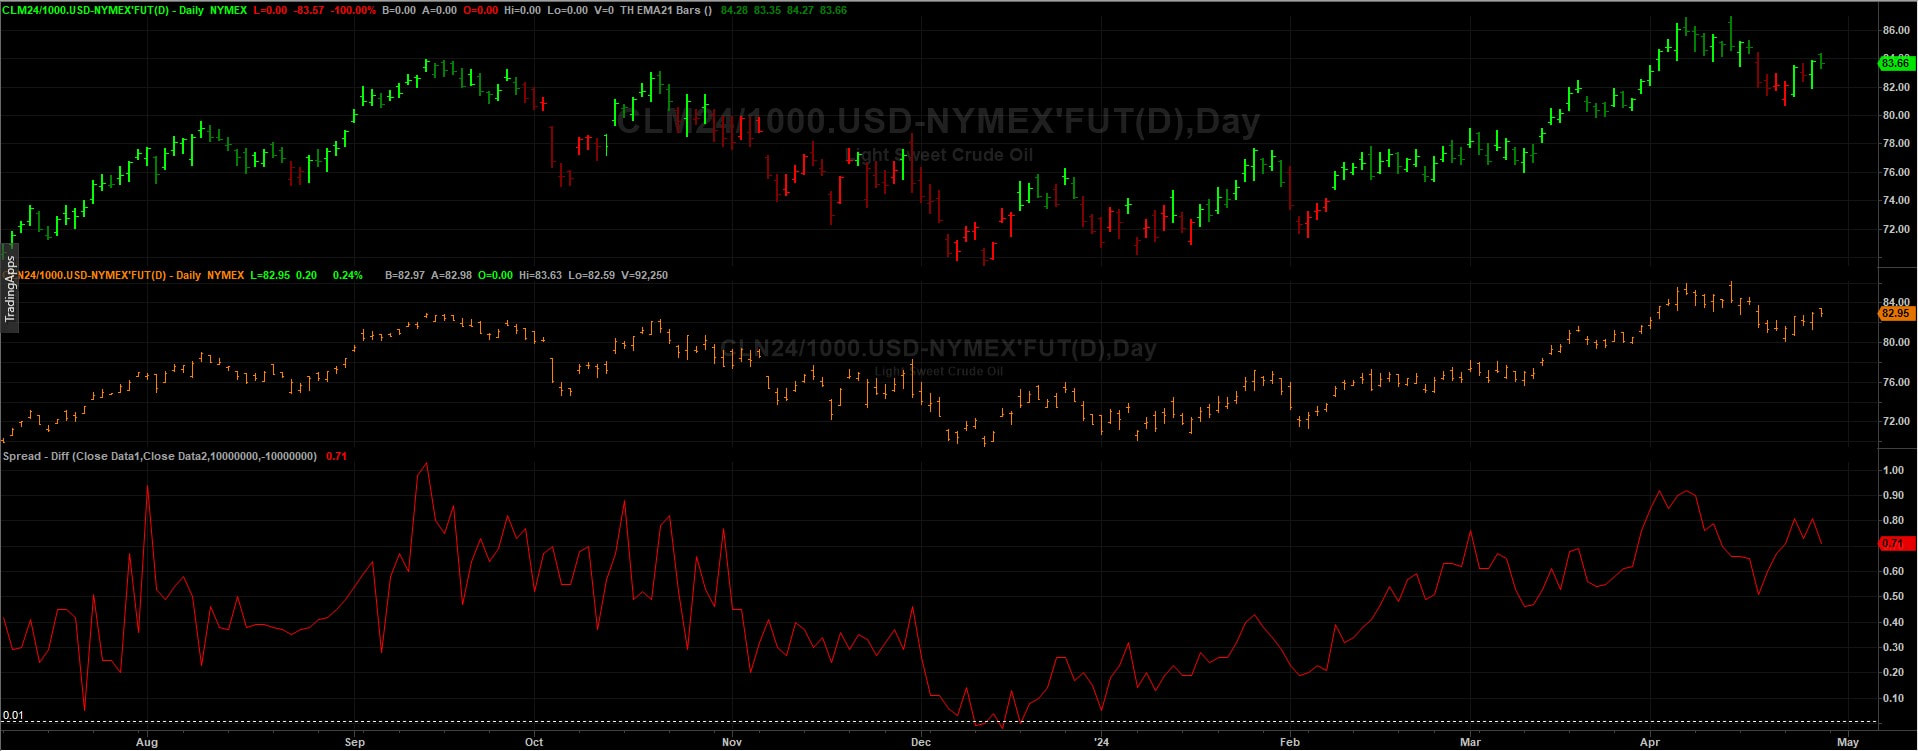 Seasonal Tendancies The seasonal for WTI crude oil has a bullish tendancy from late April into the end of June so this is supportive for the bullish camp.  Conclusion
As the crude oil market navigates through a landscape fraught with uncertainty, stakeholders must remain vigilant in their analysis of market dynamics and emerging trends. While recent inventory declines have provided a temporary boost to prices, the underlying factors driving market volatility warrant careful monitoring. By staying informed and adaptable in their strategies, industry participants can navigate the complexities of the crude oil market with resilience and foresight.
On the London Metal Exchange (LME), three-month copper prices experienced a notable 1.5% rise to $9,916 per metric ton during official open-outcry trading, edging closer to Monday's peak of $9,988, marking a two-year high. BHP Group's bid of $38.8 billion for Anglo American on Thursday aimed to create the world's largest copper miner, igniting further interest in the copper market. The US copper futures market is also rallying and price action is way above the 8 EMA and also above 3 Standard Deviations from the mean at $4.5995. We can see how the trend has developed following the period of rangebound trading from late November 2023 to mid March 2024. During this time price action was trading backwards and forwards around the 200 SMA and the market really wasn't that intersting during this period. 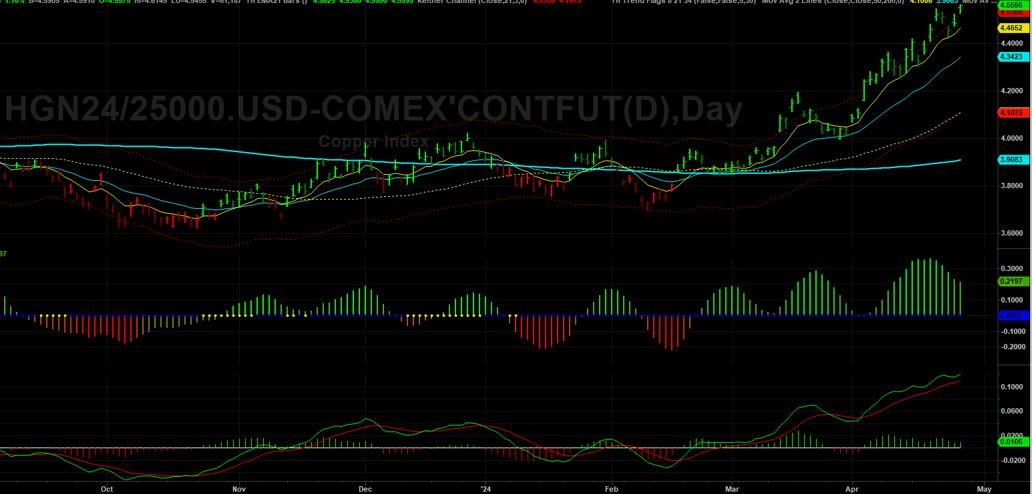 COMEX Copper Futures However, lets not get too far ahead of ourselves. In China, the Yangshan premium assessed by SMM plummeted to zero for the first time on record, signaling subdued interest in importing copper, despite being the world's leading metals consumer. The Shanghai Futures Exchange (SHFE) saw a 1.9% surge in the most traded June copper contract, closing at 80,160 yuan ($11,061.13) per ton, reflecting continued fund buying momentum. Despite challenges in the Chinese market, marked by mixed indicators, including increasing refined copper imports contrasting with inventory build-ups, bullish sentiments persist in global copper markets. CoT Data Talkoing about funds, lets take alook at positioning with the CoT data. We can see that funds are holding an extreme net long position whilst the commecials are at an extreme net position compared to the last few years. This is indicating that we have a highly crowded market and opens the door to fund liquidation in the near term. COMEX Copper Futures - CoT Data Seasonality Lets take a look at the seasonal tendancy for COMEX copper with the 5, 10 and 15 year average. As we can see from the figure below, it's not clear cut. The 5 years average shows a bias to the downside whislt the 15 year average shows a bias to the upside. 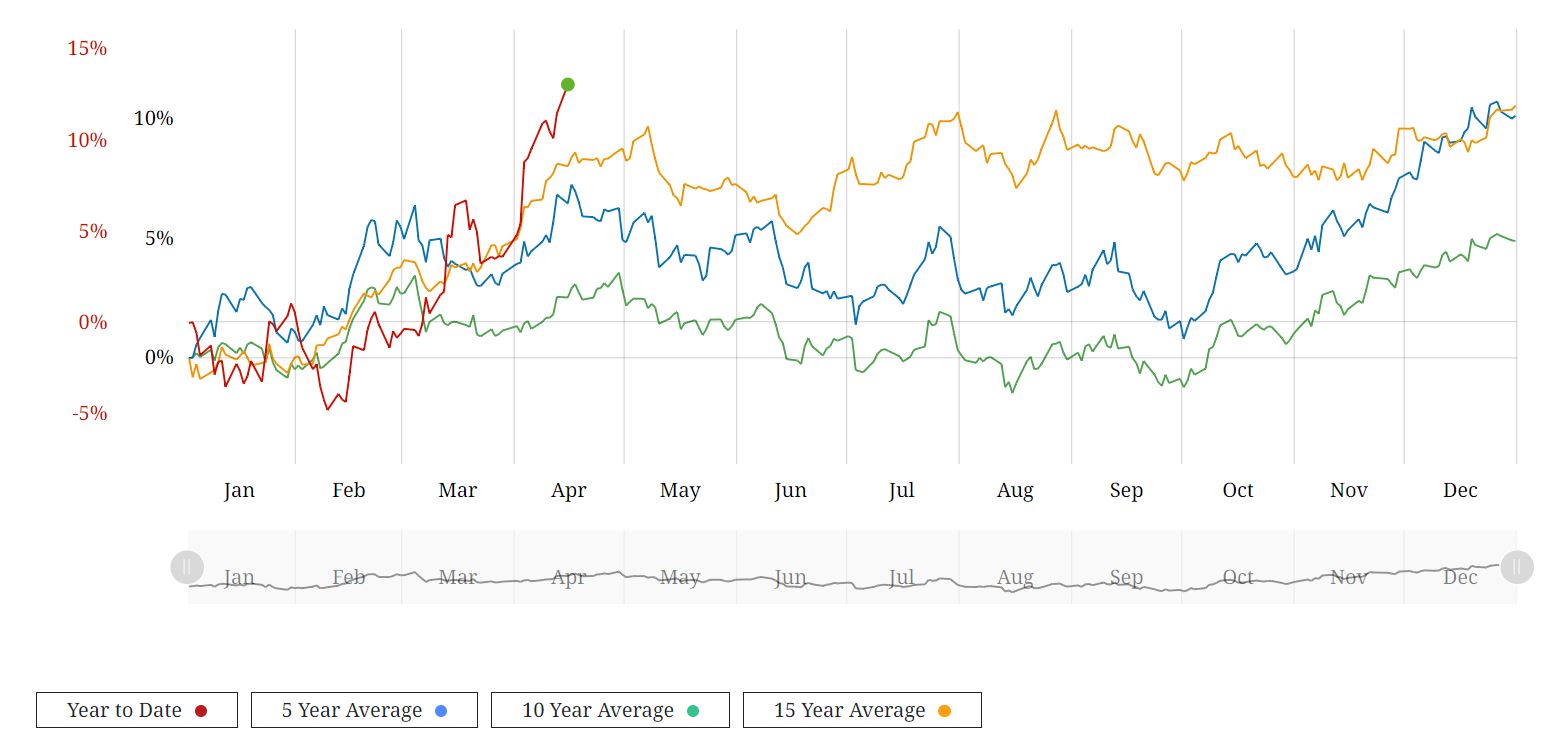 COMEX Copper Seasonality Optimism from Analysts and Invement Firms According to Citi, copper prices could soar to $12,000 per ton within the next three months, driven by supply constraints and rising demand, particularly in green industries. Furthermore, Wall Street remains bullish on copper, with Standard Chartered favoring it as their top pick across the base metals complex for 2024. Major investment firms like BlackRock and Trafigura Group anticipate even higher copper prices, necessitating substantial investments in new mines to meet growing demand from sectors such as electric vehicles and renewable energy. With that said, we need to consider the challenges in the Chinese market and the micro copper indicators that could potentially cap near-term price gains. Summary
While copper futures on the LME surged to $10,033.50 per ton, reaching levels unseen since April 2022, this year's rally is underpinned by optimism about the global economy's trajectory, despite persisting challenges in the Chinese spot market. As USD/JPY breaches the critical 155 threshold, our attention is keenly focused on potential actions from the Bank of Japan (BoJ) in the FX market. While this level has been earmarked as a trigger point for BoJ intervention by some, it's essential to acknowledge the uncertainty surrounding the BoJ's precise threshold for action. It's plausible that their intervention threshold lies closer to the 160 mark rather than 155.
The recent joint announcement involving Japan, the US, and Korea, expressing concerns over yen depreciation, may provide tacit approval for Tokyo to intervene in the FX markets. However, it's essential to consider alternative interpretations of this announcement. While it could be perceived as a signal for intervention, it might also serve as a diplomatic gesture without necessarily implying imminent action from the BoJ. Reflecting on historical precedents, the BoJ's recent interventions in the FX market have been infrequent compared to previous decades. The sporadic nature of these interventions suggests that the BoJ may adopt a cautious approach, preferring to intervene only when market conditions align with their broader policy objectives. Comparative analysis with 2022 highlights the differences in market conditions and the degree of pressure on Japan's real exchange rate. While heightened speculation may surround potential intervention, external factors such as broader trends in global currencies and economic indicators could influence the BoJ's decision-making process. Should intervention occur, its effectiveness in stabilizing USD/JPY may be limited, particularly if it's perceived as an isolated action without broader support from other central banks or market participants. Furthermore, the potential costs and risks associated with intervention, including the impact on domestic monetary policy and currency reserves, may deter the BoJ from taking immediate action. Looking ahead, while the possibility of intervention remains on the table, it's essential to approach the situation with a nuanced understanding of the factors at play and the complexities involved in the BoJ's decision-making process. As such, while USD/JPY continues its upward trajectory amidst speculation, it's prudent to consider alternative scenarios and potential outcomes in the FX market. |
AuthorTim the trader Archives
January 2025
Categories |


 RSS Feed