From the Red Sea to the Gulf of Aden, tensions simmer, and the latest focal point of concern is the strategically vital Strait of Hormuz. With over 80% of global goods transported via sea routes, any disruption in these maritime passages sends ripples across the world economy. As we delve into the dynamics of these chokepoints, the stakes become starkly evident. The Strait of Hormuz: A Crucial Artery of Global Trade At the heart of maritime trade lies the Strait of Hormuz, a narrow passage connecting the Persian Gulf with the Gulf of Oman. This vital waterway serves as a conduit for a significant portion of the world's oil and liquefied natural gas (LNG) transportation. With approximately 20% of global crude and refined product consumption passing through its waters, any disruption here reverberates globally. Nations like Saudi Arabia, Iraq, UAE, Kuwait, Iran, and Qatar heavily rely on this route for their oil exports, making them vulnerable to any attempt to block or disrupt the flow. Furthermore, Qatar's substantial LNG exports underscore the strait's growing importance in the energy landscape. Escalating Tensions and Implications The Strait of Hormuz stands at the crossroads of geopolitical tensions, with recent events exacerbating concerns over its security. Incidents such as the seizure of the MSC Aires container vessel by Iranian forces serve as ominous reminders of the risks involved. As tensions escalate, the specter of supply disruptions looms large, with potential ramifications for global oil prices. Already, the market reflects a significant risk premium, underscoring the gravity of the situation. The consequences of any escalation extend beyond the Middle East, with Asian markets particularly susceptible to supply cuts. Global Shipping Chokepoints: A Nexus of Risks While the spotlight often falls on the Strait of Hormuz, other maritime chokepoints face their own set of challenges. From the Strait of Bab el-Mandeb to the Suez Canal and the Panama Canal, disruptions abound, affecting trade flows and economic stability. Attacks by Houthi rebels in the Red Sea, coupled with environmental factors like droughts, further compound these challenges. As geopolitical tensions escalate, trade routes become increasingly politicized, amplifying risks for seafarers and cargo alike. Exploring the SonicShares™ Global Shipping ETF (BOAT) Let's dive into an in-depth analysis of the ETF that offers direct exposure to the bustling global maritime shipping industry. BOAT stands as an indexed ETF designed to mirror the performance of the Solactive Global Shipping Index, aiming to deliver results that align with this benchmark before accounting for fees and expenses. This index comprises a diverse array of global shipping companies engaged in transporting goods and raw materials across the world's oceans, encompassing a wide spectrum of cargo ranging from consumer and industrial products to vehicles, dry bulk, crude oil, and liquefied natural gas. Chart Analysis: BOAT ETF Performance Examining the chart below, which tracks the trajectory of the BOAT ETF, we observe a notable breakout from the recent downtrend, now rallying to new highs. At present, the BOAT ETF comprises 47 global shipping companies. However, we only need to focus on the top 15 weighted holdings within this ETF, as they wield the greatest influence on its overall performance. Our analysis seeks to answer which companies driving the ETF's trajectory and identifying the out performers that will ultimatly go onto our watchllist. 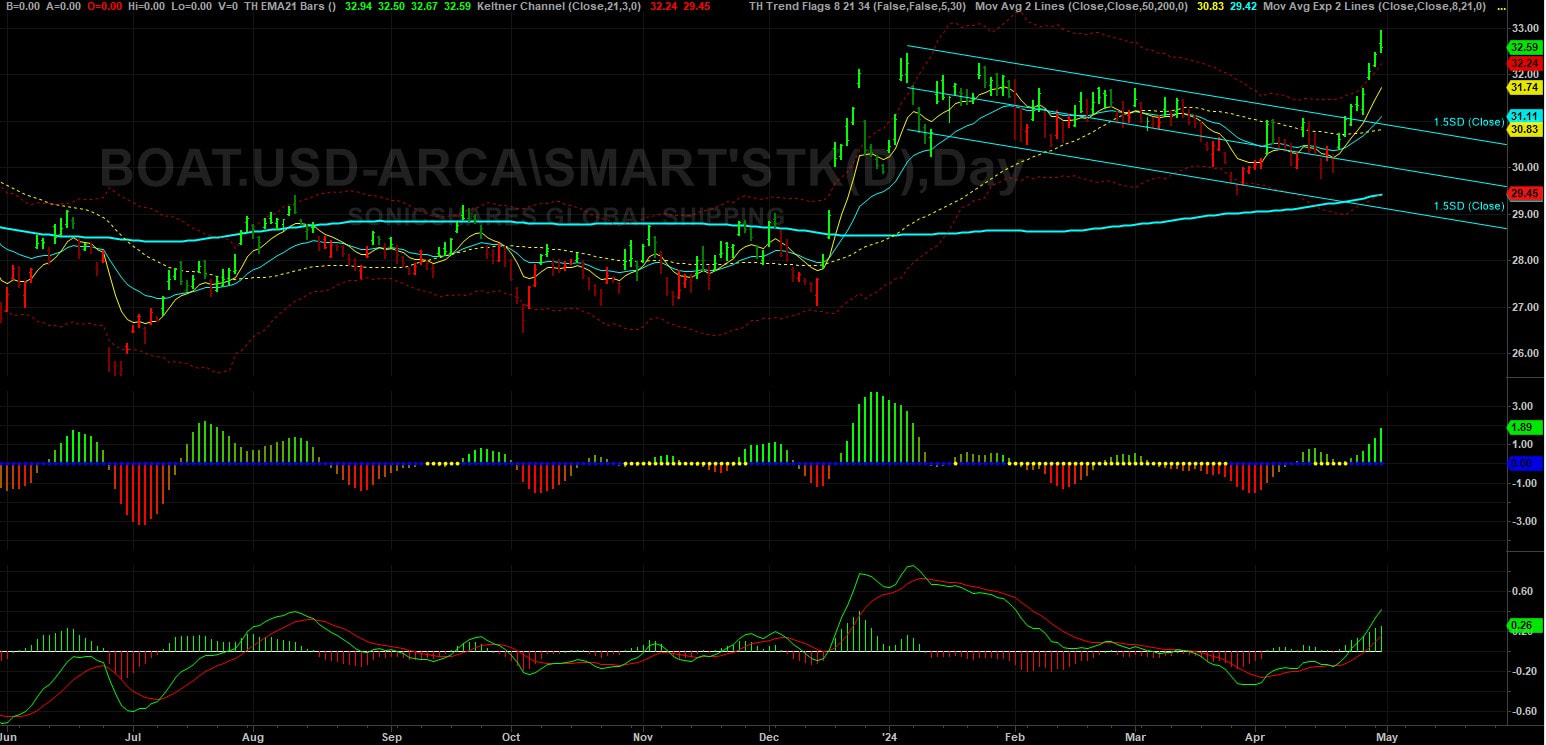 BOAT ETF Identifying Outperformers in the BOAT ETF Analyzing the chart depiction below, we pinpoint several shipping companies within the BOAT ETF that exhibit robust performance, as evidenced by discernible uptrends in their price action. Notably, Golden Ocean Group (GOGL) and Stolt-Nielsen Limited (SNI) emerge as relative outperformers within the ETF, boasting well-defined uptrends that underscore their resilience and market strength. These companies are on our watchlist, but it is not time to enter a trade yet. This is where technical tools can be used to time our entry into these markets. We'll be waiting for a reversion to the mean before we go long. 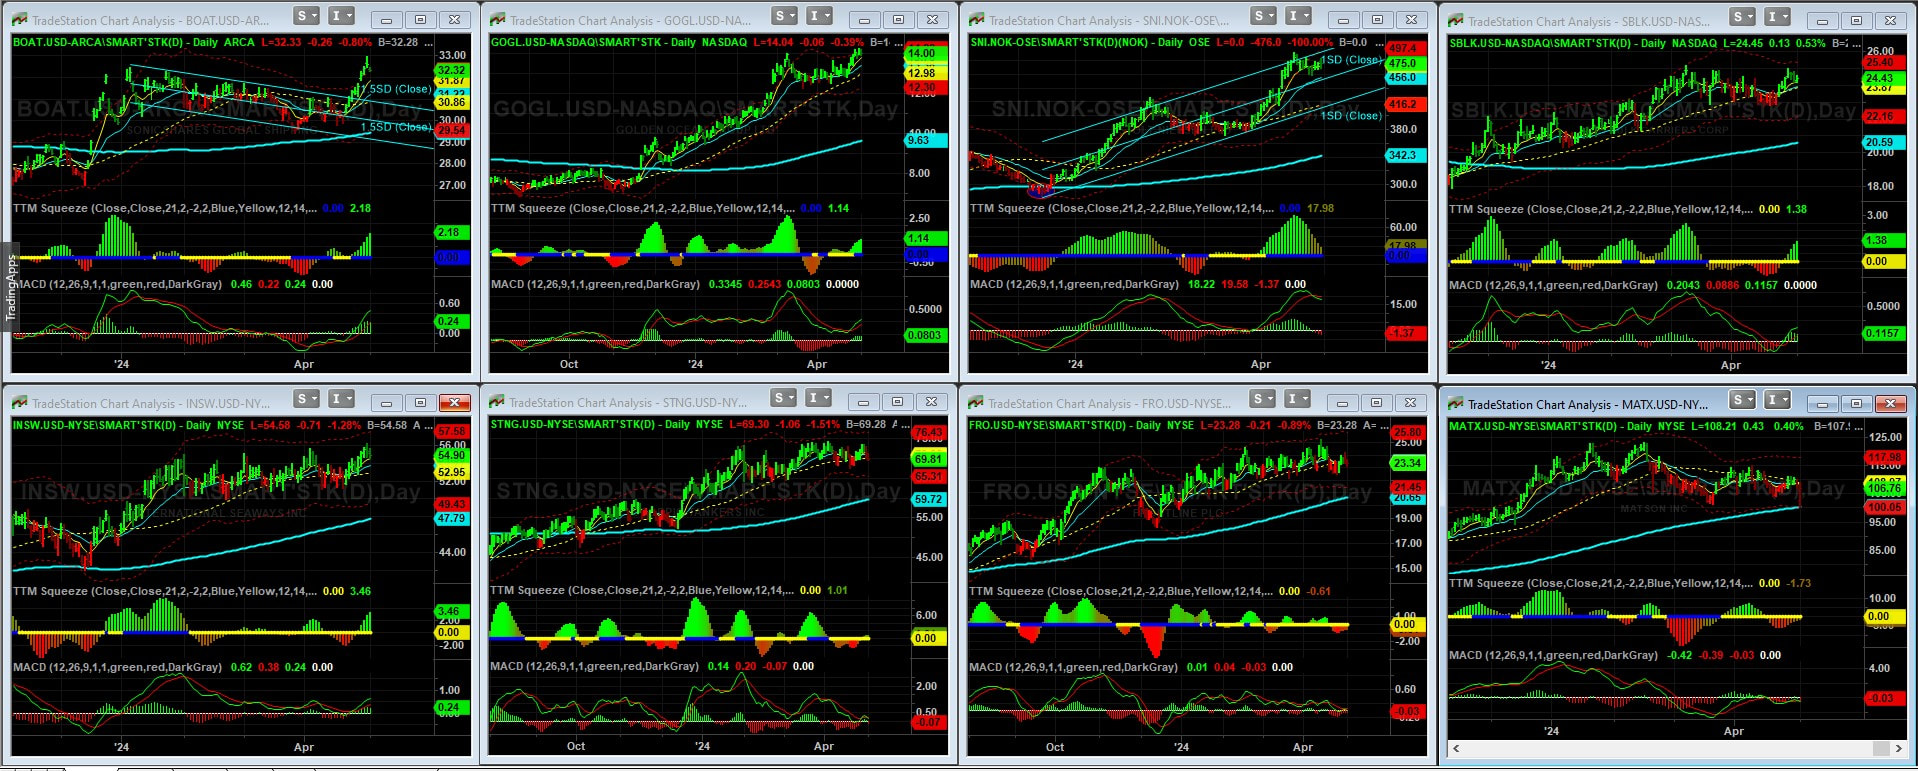 Outperformers in the BOAT ETF Conclusion: Navigating Opportunities Amidst Geopolitical Uncertainty
For traders navigating the tumultuous seas of the global shipping market, the recent developments underscore both challenges and opportunities. As geopolitical tensions escalate, maritime chokepoints become focal points of concern, potentially disrupting supply chains and impacting market dynamics. Yet, amidst these uncertainties lie opportunities for astute traders to capitalize on shifting trends and emerging patterns. The recent attention on the Strait of Hormuz highlights the critical importance of monitoring geopolitical developments and their potential ramifications on shipping routes and trade flows. As traders, vigilance is paramount, and strategic positioning can help navigate the complexities of geopolitical risk while seizing opportunities for profit. In this ever-evolving landscape, staying informed and adaptable is key. By closely tracking the performance of key shipping companies within ETFs like BOAT, traders can identify outperformers and leverage their insights to make informed investment decisions. Golden Ocean Group (GOGL) and Stolt-Nielsen Limited (SNI), among others, stand out as promising entities with strong uptrends, presenting compelling opportunities for traders seeking to capitalize on market momentum. As we chart our course through uncertain waters, we need to remain vigilant, strategic, and agile. By harnessing our understanding of geopolitical dynamics and market trends, we can navigate the challenges ahead and steer towards profitable horizons in the dynamic world of global shipping trading.
0 Comments
Masato Kanda, a top Japanese currency official, declined to confirm any intervention when questioned, stating, “No comment for now.” However, the market movements exhibit typical signs of intervention, such as the 160.0 threshold, a surge in trading volume, and the magnitude of the move. The thin liquidity conditions on a Monday morning, coupled with a Japanese public holiday, may have exacerbated the yen's spike. These developments echo those of September 22, 2022, when Japan intervened with approximately $20 billion to bolster the yen. If history repeats, the USD/JPY pair could end up trading around 156.50 by the end of the day.
Market observers are closely monitoring Japanese officials for further insights. Confirmation of intervention and indications of a sustained campaign rather than a one-off move are particularly sought after. The tendency to test officials' tolerance by selling rallies has been observed in past interventions, although reluctance to push the pair too close to 160.0 again is evident from the September 2022 experience. Additionally, with a week filled with significant US events, including a potentially hawkish Fed and strong economic data, the yen could face renewed pressure. In Monday's early American session, USD/JPY found temporary support near 155.00 following a steep decline from its historic highs of 160.00, which market participants attributed to suspected Japanese intervention. Despite speculation, Masato Kanda refrained from confirming any FX intervention during his speech in the European session. However, he emphasized the negative impact of speculative and rapid FX movements on the economy. Expectations of further intervention remain high as the Japanese yen continues to weaken. The Bank of Japan's shift towards monetary policy tightening after a prolonged period of ultra-easy monetary policy has not provided firm support for the yen. Concerns persist regarding the limited scope for policy tightening due to uncertainties surrounding wage growth. While the BoJ moves cautiously towards policy normalization, expectations of sustained policy divergence between the BoJ and the Federal Reserve hinder the yen's stabilization.
Crude Oil and Gasoline Inventories: A Closer Look The United States witnessed a notable decline in crude oil inventories, with a reduction of 3.23 million barrels reported by the American Petroleum Institute (API) for the week ending April 19. This came as a surprise to analysts who had anticipated a build of 1.8 million barrels. Additionally, the Department of Energy (DoE) reported an increase in inventories within the Strategic Petroleum Reserve (SPR), reaching 365.7 million barrels—the highest level since last April. Market Reaction and Price Trends The news of declining crude oil inventories sparked a bullish sentiment in the market, leading to an uptick in oil prices. This optimism was further fueled by a weakening U.S. dollar index and concerns over sluggish business activity. However, despite these inventory fluctuations, prices have yet to surpass the critical $90 per barrel mark. Factors Driving Price Volatility Several factors have contributed to the recent volatility in oil prices. Geopolitical tensions in the Middle East, particularly the escalating conflict between Israel and its neighbors, have raised concerns about potential disruptions to oil supply routes. Furthermore, macroeconomic indicators such as U.S. inflation data have added to market uncertainty, influencing investor sentiment and price dynamics. Bullish Catalysts and Market Outlook Despite these challenges, oil prices are poised for a weekly gain, driven by a combination of inventory declines, a slowdown in U.S. manufacturing, and ongoing geopolitical tensions. However, concerns persist regarding the sustainability of this upward trajectory, as economic headwinds and supply-side risks continue to loom over the market. Positioning The CoT data shows Funds and Commercials at an extreme level so this warrants caution moving forward. Clearly, this condition can persist for some time but it also opens up the risk of fund liquidation if or when price action move towards 3 standard deviations from the mean. 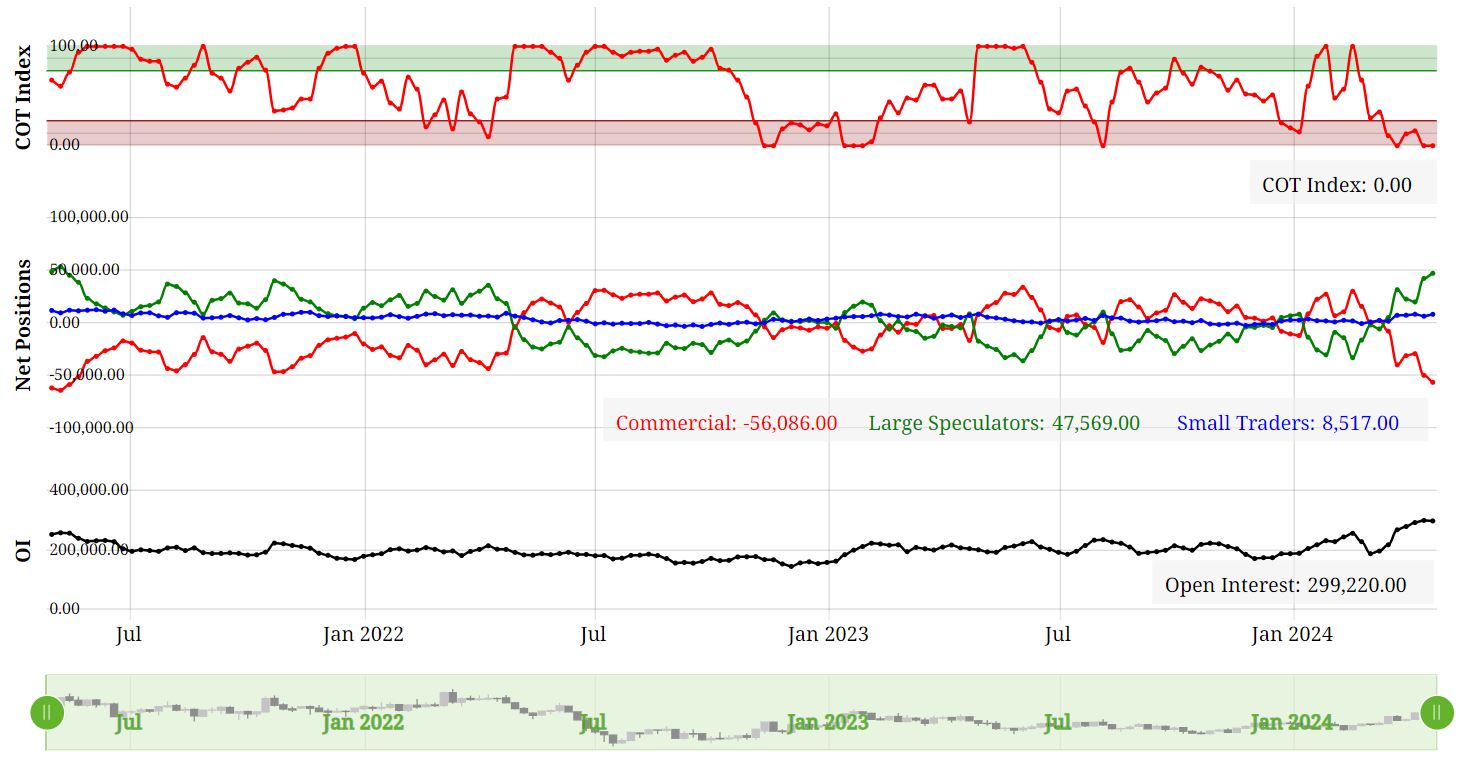 Futures Contract Spreads The inter-contract futures spread in WTI crude oil is currently in backwardation. In other words, the nearby is at premium to the next contract out and this has been increasing over the last few months. It's not a significant premium at this stage, but one to keep on the watchlist. Any escalation in the geo-political situation in the middle-east could drive this premium further. 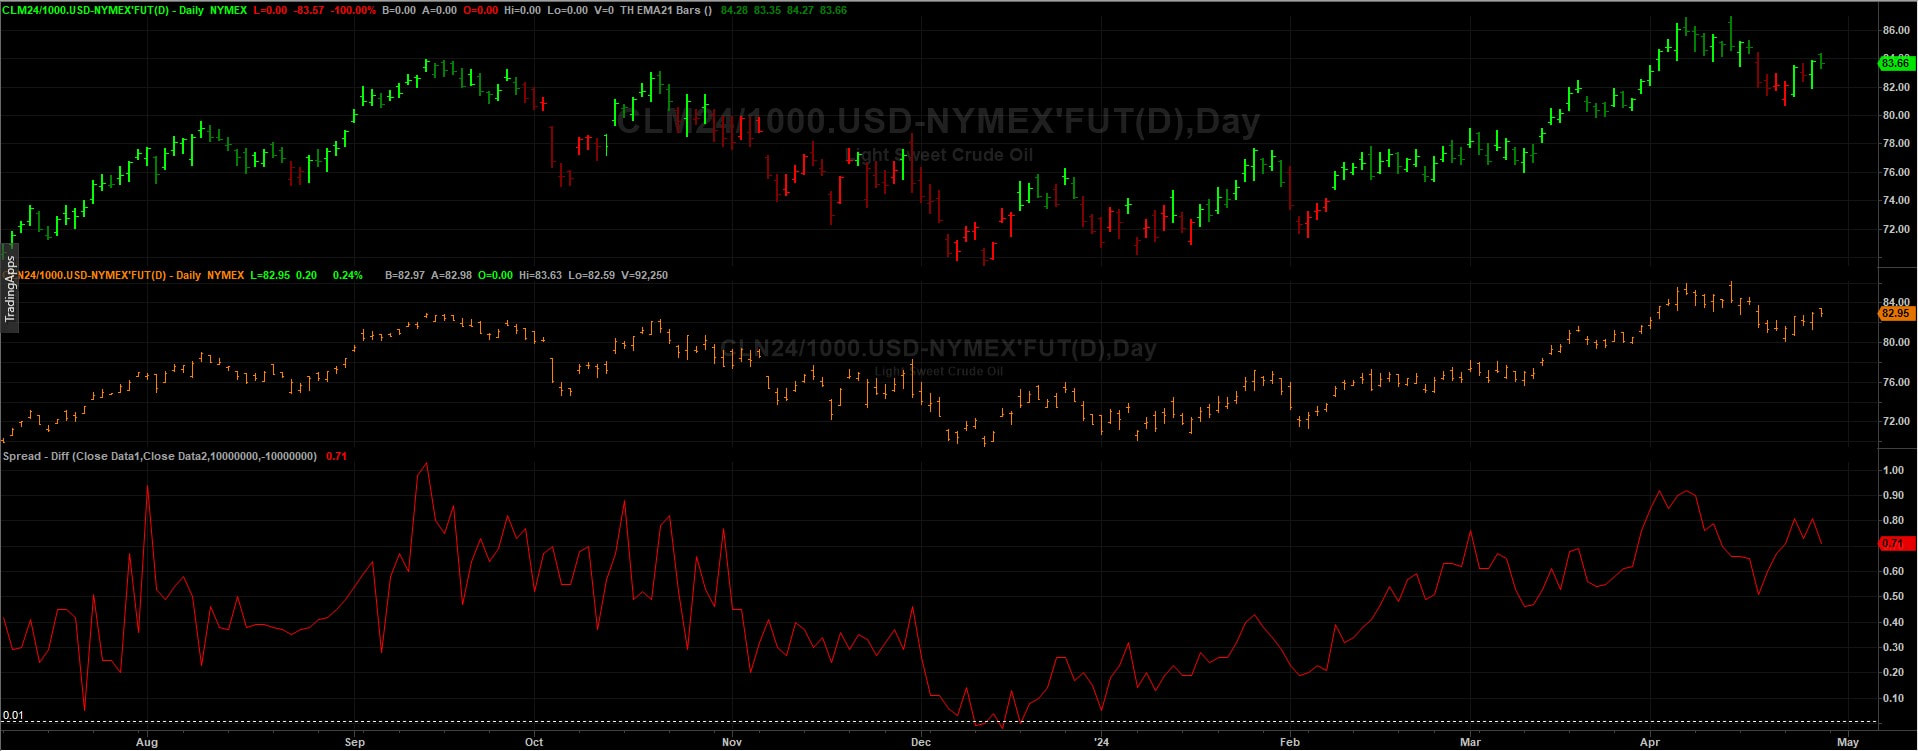 Seasonal Tendancies The seasonal for WTI crude oil has a bullish tendancy from late April into the end of June so this is supportive for the bullish camp.  Conclusion
As the crude oil market navigates through a landscape fraught with uncertainty, stakeholders must remain vigilant in their analysis of market dynamics and emerging trends. While recent inventory declines have provided a temporary boost to prices, the underlying factors driving market volatility warrant careful monitoring. By staying informed and adaptable in their strategies, industry participants can navigate the complexities of the crude oil market with resilience and foresight.
On the London Metal Exchange (LME), three-month copper prices experienced a notable 1.5% rise to $9,916 per metric ton during official open-outcry trading, edging closer to Monday's peak of $9,988, marking a two-year high. BHP Group's bid of $38.8 billion for Anglo American on Thursday aimed to create the world's largest copper miner, igniting further interest in the copper market. The US copper futures market is also rallying and price action is way above the 8 EMA and also above 3 Standard Deviations from the mean at $4.5995. We can see how the trend has developed following the period of rangebound trading from late November 2023 to mid March 2024. During this time price action was trading backwards and forwards around the 200 SMA and the market really wasn't that intersting during this period. 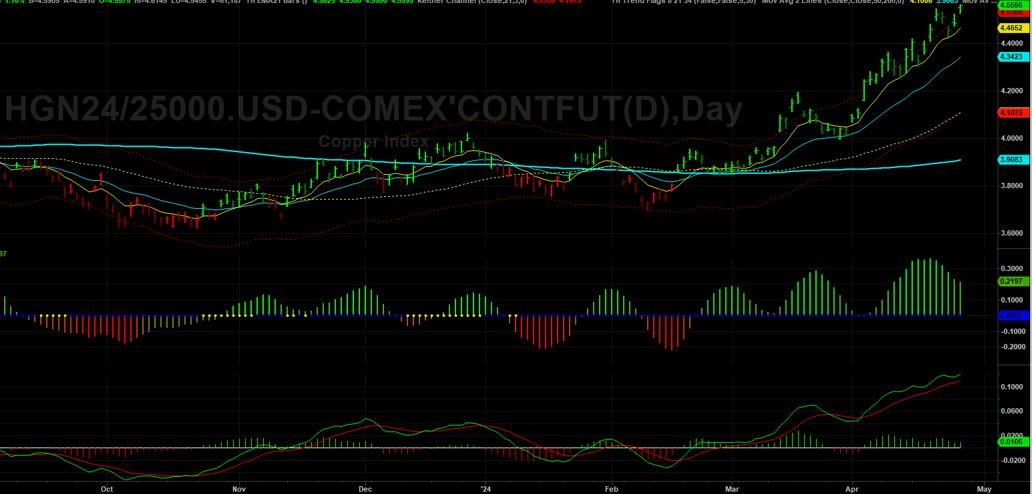 COMEX Copper Futures However, lets not get too far ahead of ourselves. In China, the Yangshan premium assessed by SMM plummeted to zero for the first time on record, signaling subdued interest in importing copper, despite being the world's leading metals consumer. The Shanghai Futures Exchange (SHFE) saw a 1.9% surge in the most traded June copper contract, closing at 80,160 yuan ($11,061.13) per ton, reflecting continued fund buying momentum. Despite challenges in the Chinese market, marked by mixed indicators, including increasing refined copper imports contrasting with inventory build-ups, bullish sentiments persist in global copper markets. CoT Data Talkoing about funds, lets take alook at positioning with the CoT data. We can see that funds are holding an extreme net long position whilst the commecials are at an extreme net position compared to the last few years. This is indicating that we have a highly crowded market and opens the door to fund liquidation in the near term. COMEX Copper Futures - CoT Data Seasonality Lets take a look at the seasonal tendancy for COMEX copper with the 5, 10 and 15 year average. As we can see from the figure below, it's not clear cut. The 5 years average shows a bias to the downside whislt the 15 year average shows a bias to the upside. 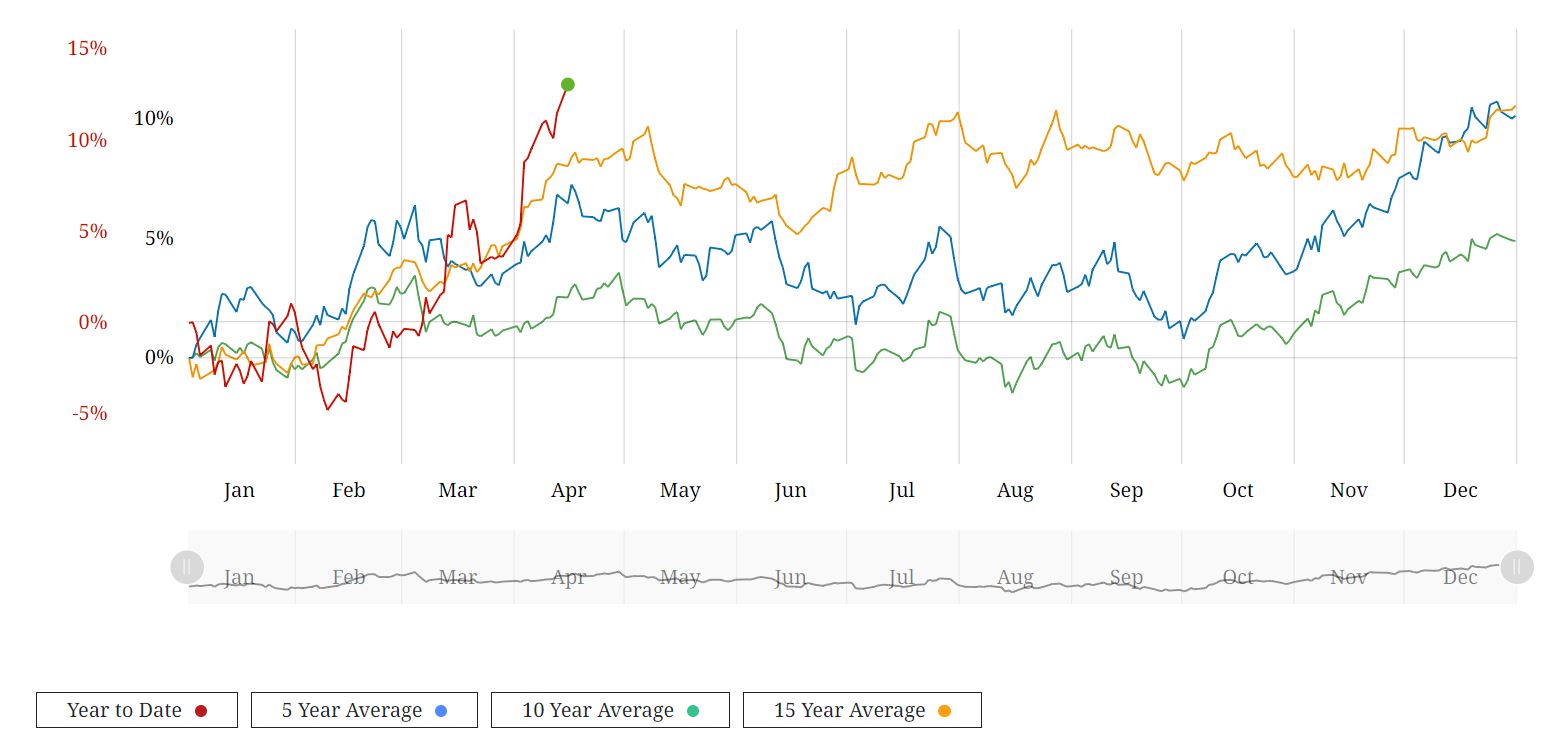 COMEX Copper Seasonality Optimism from Analysts and Invement Firms According to Citi, copper prices could soar to $12,000 per ton within the next three months, driven by supply constraints and rising demand, particularly in green industries. Furthermore, Wall Street remains bullish on copper, with Standard Chartered favoring it as their top pick across the base metals complex for 2024. Major investment firms like BlackRock and Trafigura Group anticipate even higher copper prices, necessitating substantial investments in new mines to meet growing demand from sectors such as electric vehicles and renewable energy. With that said, we need to consider the challenges in the Chinese market and the micro copper indicators that could potentially cap near-term price gains. Summary
While copper futures on the LME surged to $10,033.50 per ton, reaching levels unseen since April 2022, this year's rally is underpinned by optimism about the global economy's trajectory, despite persisting challenges in the Chinese spot market. As USD/JPY breaches the critical 155 threshold, our attention is keenly focused on potential actions from the Bank of Japan (BoJ) in the FX market. While this level has been earmarked as a trigger point for BoJ intervention by some, it's essential to acknowledge the uncertainty surrounding the BoJ's precise threshold for action. It's plausible that their intervention threshold lies closer to the 160 mark rather than 155.
The recent joint announcement involving Japan, the US, and Korea, expressing concerns over yen depreciation, may provide tacit approval for Tokyo to intervene in the FX markets. However, it's essential to consider alternative interpretations of this announcement. While it could be perceived as a signal for intervention, it might also serve as a diplomatic gesture without necessarily implying imminent action from the BoJ. Reflecting on historical precedents, the BoJ's recent interventions in the FX market have been infrequent compared to previous decades. The sporadic nature of these interventions suggests that the BoJ may adopt a cautious approach, preferring to intervene only when market conditions align with their broader policy objectives. Comparative analysis with 2022 highlights the differences in market conditions and the degree of pressure on Japan's real exchange rate. While heightened speculation may surround potential intervention, external factors such as broader trends in global currencies and economic indicators could influence the BoJ's decision-making process. Should intervention occur, its effectiveness in stabilizing USD/JPY may be limited, particularly if it's perceived as an isolated action without broader support from other central banks or market participants. Furthermore, the potential costs and risks associated with intervention, including the impact on domestic monetary policy and currency reserves, may deter the BoJ from taking immediate action. Looking ahead, while the possibility of intervention remains on the table, it's essential to approach the situation with a nuanced understanding of the factors at play and the complexities involved in the BoJ's decision-making process. As such, while USD/JPY continues its upward trajectory amidst speculation, it's prudent to consider alternative scenarios and potential outcomes in the FX market. |
AuthorTim the trader Archives
January 2025
Categories |


 RSS Feed