Corn The June WASDE report from the USDA was moderately supportive of corn prices, with changes to the US and global 2020/21 balance sheets leading to a tightening of supply. In the US, both domestic demand and export estimates were increased for the 2020/21 marketing year by a combined 150m bushels. Consequently, US ending stocks decreased to 1.1 billion bushels, which ws below expectations of about 1.2 billion bushels. For the 2021/22 season, there were no changes to the US corn balance. With regards to the global corn balance, the Brazilian corm crop had the largest change for the 2020/21 season. The drought conditions in the region has impacted the safrinha corn crop. The USDA revised the Brazilian production down to 98 million tonnes from 102 million tonnes, which still leaves output higher than expected. For 2021/22, global corn stocks are expected to grow year on year which means there is a probabaility that prices could weaken from current levels as the new corn crop becomes availble, but only if the weather through the summer months is favorable. So weather is the key factor to watch over the coming months. Another key factor is on the demand side and this is the Chinese imports through 2021/22 and wether we'll continue to see the level of demand that we did in 2020/21. The USDA is forecasting that China imports will total 26 million tonnes which is unchanged from eh current season's estimate. Corn Supply/Demand Balance 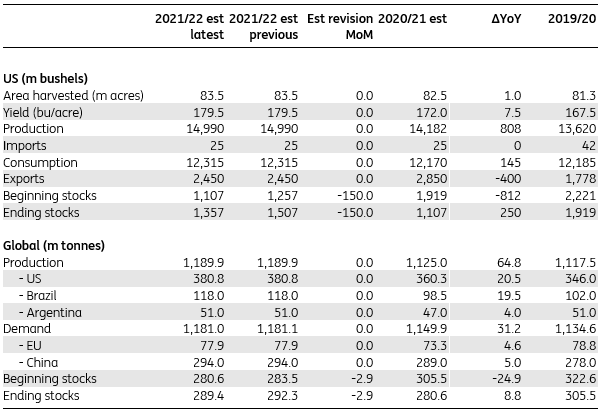 Source: USDA Soybeans The WASDE numbers were not as supportive for soybeans as they were for corn. The USDA revised their US domestic demand estimate by 15 million bushels for the 2020/21 marketing year, and consequentl, ending stocks are coming in at 135 million bushels which was higher then expectations of about 120 million bushels. With regard to the global soybean balance for 2020/21, the market is expecting to see ending stocks edge higher, with an estimate of 88 million tonnes which is anincrease over the previous estimate of 86.55 million tonnes and higher then expectations of about 87.4 million tonnes. The reason for these higher numbers is a softening of demand in the US and an increase in Brazilian production which was revised higher to 137 million tonnes from 136 million tonnes. The 2021/22 global balance sheet saw marginal changes to demand & supply, with higher ending stocks driven by expectations of a larger carryover of inventories from the current marketing year. As a result, global ending stocks for 2021/22 are forecast to increase to 92.55 million tonees with increased output from Brazil, the US and Argentina. This suggests a higher probability of soybean prices trending lower in the next marketing year, assumming that we don't any supply shocks to change the suplly and demand picture. Soybean Supply/Demand Balance 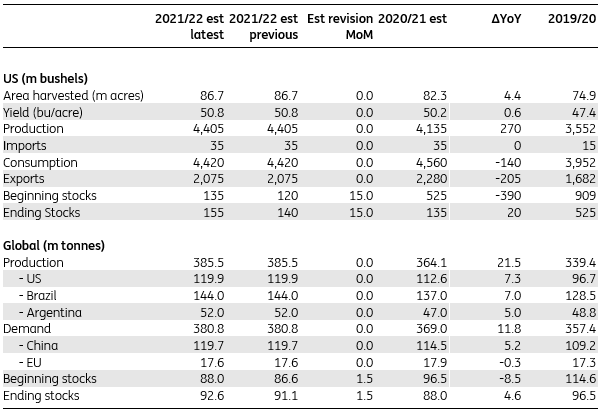 Source: USDA Wheat The WASDE reports hsowed the US wheat balance was largely unchanged for 2020/21, however, the USDA did revise the exports higher by 20 million bushels. This leaves ending stocks at 852 million bushels, which ws lower than expectations of about 870 million bushels. Consequently, beginning stocks for 2021/22 are a bit lower but this is offset by expectations of higher output in 2021/22. Ending stocks for 2021/22 are estimated at 770m bushels compared to market expectations of more than 780m bushels. With regard to the global balance, the USDA increased its supply estimates for 2021/22 on higher production from Europe, as recent rains were seen beneficial for the current crop. They also revised global production estimates higher. by 5.5 million tonnes witht he majority of this coming from Europe. Global production is now projected to increase 2.4% year on year to a record high of 794.4 million tonnes. Global demand estimates were also revised higher by around 3 million tonnes, which was mostly driven by Europe. Consequently, 2021/22 global ending stocks estimates were increased by around 1.8 million tonnes to 296.8 million tonnes, which was above market expectations of 294 million tonnes. Wheat Supply/Demand Balance 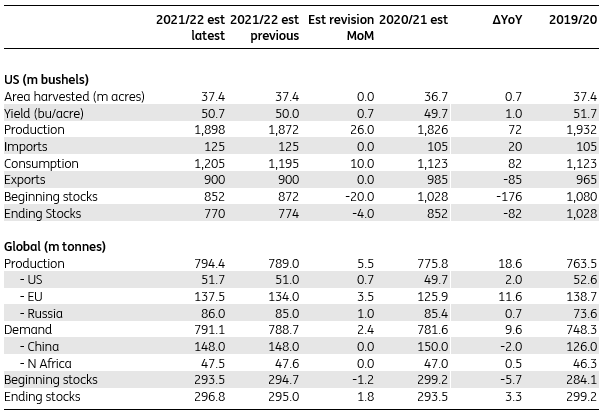 Source: USDA
0 Comments
This follows on from repeated warnings coming out of China from officals talking about high commodity prices after surging producer inflation strengthened China’s resolve to keep commodity prices in check. On Wednesday, China’s state planner renewed its pledge to step up monitoring of commodity prices and strengthen supervision of spot and futures markets, as domestic producer inflation hit its highest in more than 12 years. Indeed speculation continues about the potential for the China State Reserve Bureau (SRB) to release stock. At this point, they are essentially trying to talk the market down. This strategy could be working as some investors are becoming cautious and with unconfirmed talk of the SRB releasing copper, aluminium, and zinc stocks at the end of each month and we could see a steeper correction in the copper market over the coming weeks. Indeed, on the Thursday this week, the 3-month copper on the London Metal Exchange fell 0.6% to $9,920 a tonne early in the morning, while the most-traded July copper contract on the Shanghai Futures Exchange dipped 0.5% to 71,290 yuan ($11,167.15) a tonne. But copper prices have had a good run this surging by 28% on the LME and 21% on ShFE. Last month, both contracts hit record highs and looking very overbought on the charts. Therefore, a correction is quite likely at these levels and talk from China about price controls and rumours of releasing stock from the SRB will serve as a catalyst for the correction and we could see significant long liquidation. Inflation Narrative In addition, there is the narrative around US inflation and the market is awaiting the latest figures due out later on Thursday for clues the Fed's position on tapering. If there are any signals of tapering or even thinking about talking about tapering, then this could dampen demand for copper and metals in general. Developments in Peru The markets have also been focused on the Peruvian election results. If Castillo wins, this could add to the risk premium for long term copper mine supply. This is a long term narrative that mine investments may fall short of the expected surge in demand. Chinese Imports The customs dat on Monday showed that China’s copper imports fell 8% in May from the previous month, as record-high prices dampened demand from the world's largest importer and consumer of copper. Imports of unwrought copper and copper products came in at 445,725 tonnes in May. That was down from 484,890 tonnes in April for a second straight month-on-month drop but up from 436,030 tonnes in May 2020. Growth in China’s manufacturing sector, a key copper consuming sector, slowed slightly in May as raw materials costs rose at their fastest pace in over a decade. If we look at the Yangshan copper premium SMM-CUYP-CN, paid on top of London prices for delivery of physical copper into China, we see that it is at its lowest since 2016 at $28 a tonne. This just confirms the lower buying interst in China at this time. The record high copper prices hare causing some buyers in China to sit on the sidelines and manufacturers are reportedly trimming down operations. The increasing gap between Chinese PPI and CPI implies to some degree that many manufacturers stuck in the middle are absorbing the higher costs and this will dampen any appetite for stockpiling. By the end of May, the copper inventories in Shanghai bonded warehouses SMM-CUR-BON increased to 415,500 tonnes, which is the most the most since July 2019. Continued high prices are are likely to have an impact on future imports, however, even with the monthly declines, overall import levels are still relatively high. In Summary The market is getting cautious about China retreating in its copper purchases, but the recent weakness in prices has been seen across the industrial metals complex. Much of the market gyrations we have seen in recent markets closely track the broader macro market activities. There have been rising speculations on Fed tapering, and any signalling of the earlier tapering than expected will cauase the US dollar to rally, which will also have an impact on copper prices and commodities in general causing more downside pressure.
New orders confirm this as they increased to 67 from 64.3 and backlog orders were at all-time highs. This tells us that the US manufacturing sector continues to perform very strongly, but at the same time, supply chain issues are casuing a few problems for output and the knock on effect of this is increasing prices. We are also seeing delivery times increase to their highest since 1974 and no doubt impacted by shortages in the auto industry and challenges in recruiting workers.
Finding Workers The employment figures show there are challenges in finding workers. Home schooling has forced parents to say at home and indeed some people are in no rush to go back to work given the pandemic. The uprated unployment benefits are also not creating an incentive to return to work when taking into account childcare costs etc. Its unlikely that these factors will ease off any time soon and may impact the labour figures for some time to come. Struggling to Keep up with Demand Consumer demand is high following the lifting of COVID-19 restrictions and people want to spend some money. Inventories are at an all time low and those supply chain constraints are causing delays in replenishing inventory. Throw these into the melting pot and you've got a recipe for inflation. With high demand, constrained supply and increasing input prices, it's not dfficult to see inflation heading northward for some time to come and potentially more persistent than the Fed expects.
Annualised GDP growth in Q1 came in at 5.6%, whicih was was below the expectation of 6.3% growth. But we can't too disappointed by this miss to the downside because the Candian economy recovery is on the right track. Tle labour market is strong, fiscal policy is supportive, commody prices are rising and the vaccination program is going well.
A Good Mix of Growth The Canadian GDP shows growth in numerous areas. Consumer spending rose an an annualised rate of 3.4%, investment was up 17%, government was up 6.2% and net trade made a positive contribution. However, inventories subtracted 1.4% from the headline growth. This leaves GDP output 1.5 percentage points below the pre-pandemic peak and in the current quarter, there is a strong possibility of output being the same as or better than pre-pandemic lavels. Overall, its a good mix of growth. How Does Canada Compare with the US? The vaccination program has been firing on all cylinders and is currently getting turbo boost as it overtakes the US in terms of the proportion of the population haveing recieved at least one vaccination dose. In addition, the labour market is also bouncing back more strongly than in the US with employment just 2.4 percentage points below its pre-pandemic peak. In contrast, US employment is 5.4 percentage points below its pre-pandemic peak. Inflationary Pressures? Helping this along is the ongoing stimulus, and increasing commodity prices but is this causing inflation to run hot? Inflation is certianly on an upward trajectory moving above target so the Bank of Canada is on track to taper its weekly QE asset purchases for a third time in July and rate hikes in the seond half of 2022. With all these factors in the melting pot, the scene is set for a robust economic recovery.
Inflation is coming back at a significant rate of knots at the same time as the economic recovery builds momentum. All eyes now turn to the ECB, but it is highly unlikely that they will be talking about tapering at the June meeting. In recent weeks we have heard from various ECB speakers talk against premature tightening and that inflation is expected to be temporary.
What is Driving Inflation? Energy inflation is the main culprit for the increase in prices. Oil prices have increased significantly over the last year and even with recent sideways movment since Febraury , Eurozone pertol prices hvae continued to rise modestly, reaching the highest level since mid-2019 two weeks ago. In conjunction with base effects, this has pushed energy inflation up from 10.4% in April to 13.1% in May. However, the base effect will moderate and this will reduce the impact of emergy inflation over the coming months, but don't think that this is the end to higher inflation. Inflation on goods will increase too and we are already seeing signs of this with higher input costs in manufacturing as well as supply chain issues, shortages and high capacity utilisation which are contributing to higher price pressuress. In May, it increased from 0.4% to 0.7%, and this is likely to continue trending up as supply chain issues continue for several months more and demand for goods remains strong. For services, it is a bit slower as COVID-19 restrictions are still in place in many countries. Reopenings are underway across the Eurozone but it is still a bit early to see the effect of these showing up in the numbers just yet and we may ned to wait until June to see this. Declining Unemployment Unemployment declined to 8% in April as the labour market continues to improve resulting from the lifting of COVID-19 restriction. However, the unemployment picture is affected by the furlough schemes that are still in place across the eurozone. This results in a very low unemployment rate and it will be intersting to see what happens when the furlough shcemes end. A strong economic recovery will ppotentially limit any layoffs that are delayed becuse of the furlough but we have to take into account that businesses have had to restructure through this pandemic and the lockdowns in order to survive. Cashflow and balance sheets have been damaged and there will be a lot of work to recover from this. Fortunately, there is pent up demand that will help in this recovery an potentially limit any impact on the labour market. We are already seeing strong demand which will boost GDP but also add to inflationary pressures. Higher Inflation - Temporary or Structural? With goods and services inflation set to increase more due to the reasons already mentioned, the question becomes, is this temporary or is this structural? ther eis no crystal ball for this and three will be extended debate on this for months to come. The economic recovery is building momentum but at some point after a few months of strong numbers, this will level off and we'll also see supply chain issues easing. As this happens, it is likely that in early 2022, we'll see inflation moderating.
Manufacturing PMI
The Markit Manufacturing PMI came in at 63.1 in May which was up on the previous month and above expectations of 62.8. This pointed to new record growth in factory activity. Output growth was the slowest in three months, though it remained close to March’s record with production again underpinned by rapid gains in new orders. There have been increasing production disruptions in the manufacturing sector due to supply chain issues. Demand is returning quickly as new orders continue to flow in at a fast pace. Therfore, backlogs of work are increasing as supply is struggling to keep up with demand. Services PMI The Markit Services PMI came in at 55.2 in May which was up on the previous month and slightly above expecations at 55.1. This was strongest pace of expansion since June 2018. All countries in teh Eurozone recorded an improvement in activity since April, with Ireland and Spain leading the way, following the easing of COVID-19 restrictions. New business rose for the first time since last July, and at the fastest rate for 40 months. Looking ahead, business sentiment hit a 17-year high. Composite The Markit Composite PMI came in at 57.1 in May which was up from the previous month but just below expectations of 55.1. With restrictions over recent months mainly focused on services, it is no surprise that the services PMI soared from 50.5 to 55.2 in May with many countries easing restrictions and vaccination programs build momentum. The Outlook The combination of demand returning quickly for manufactured products in conjunction with shortages and delays in the supply chain are creating the ideal conditions for a surge in pipeline inflation. We are already seeing significatn increases in input prices and the PMIs show that manufacturing businesses are already passing these higher costs onto consumers. This makes sense as businesses can only absorb higher input costs to a certain degree before before margins get squeezed to the point where they have to pass the higher costs onto the consumer. For services, inflation is behind that of manufcturing but as reopenings continue, we could see service infation moving higher. Overall, the economic outlook for the eurozone is looking very positive at the moment with stronger growth and inflation pressures increasing. If the re-opening and vaccination programme stay on track and build momentum, then it is highly probable that the pace of economic recovery will improve significantly in the 2nd quarter.
In conjunction with the re-opening, we have rising consumer confidence which suggests that spending will remain strong over the next few months. However, online shopping will still dominate so the high street could still feel the pressure and a challenging recovery.
April's surge in retail sales was significantly greater than expectations with a 9% month on month jump. This means that sales are 10% above pre pandemic levels! This is to be expected after another prolonged lockdown with lots of pent up demand. People simply weren't buying new clothes or shoes as many places were closed and events cancelled. This shows up in the data as clothing and footwear had the largest increases. Will It Last? The vaccination programme is steaming ahead at full speed and we can see the light at the end of the tunnel. People are feeling more confident about their safety and getting back to some degree of normality as well as more confidence in the economic recovery. The economic indicators are looking increasingly positive but there are still a few crosswinds in some of the data. On the High Street Trading conditions are still a bit vulnerable on the high street as the trend to online shopping continues. The novelty of going to the shops again following the lock down may not last as people revert to online shopping. Foot fall for the High Street restailers is not as good as it could be but this may improve when the offices reopen and people make there way back to the workplace. In addition, High Street retailers are under pressure from rent arrears and costs linked to the pandemic so cashflow is taking a hit. Conclusion Futher gains are on the radar for reatil sales but we might see the spending going to the online retailers rather than the High Street.
The annual inflation rate in the US soared to 4.2% in April 2021 from 2.6% in March, which was significantly above market forecasts of 3.6%. Indeed, it is the highest reading since September 2008. We don't have to look too hard or far to see why this is happening. We have been in a reflationary environment with a tsunami of demand as the economy reopens. We've got soaring commodity prices with grains and energy markets heading north at a rate of knots. We've seen supply chain issues and shortages in the semiconductor market. We've also got the base effect as the April inflation numbers come a year after the pandemic lockdown when the economy was in dire straights. The Base Effect If we look at this just from the perspective of the base effect, you could say this is transitory inflation. The rationale being that, we move forward, away from the April 2020 measuring point, which is now known as "The Great Lockdown" and resulted in the worst economic downturn sine the Great Depression, we could see inflation cooling a little bit. However, as mentioned, this is only one factor in the melting pot. We've got other inflationary pressures creeping in to the mix. Supply and Demand On the supply side, businesses are dealing with increasing cost for raw materials and fuel. Look at the price of copper and lumber in the construction business as well as the uptrend in crude oil and refined products. On the demand side, we've got consumers with more cach in their pockets from stimulus cheques and more savings. As the lockdowns ended, people wanted to spend some of that money. Tighter supply and increased demand equals higher prices. So the inflation numbers we are seeing may not be as transitory as the Fed would have us beleive! Wages Increases In addition, there is the impact of wage increases. Inflation expectations have been well anchored in recent years but comsumer inflation expectations are picking up so we could see more upside pressure on wage increases. In an environment of higher inflation, employees expect the wages to increase in line with inflation and to offset the effects of this in their own cost of living. Companies are also under pressure to increase wages to attract new employees. The jobs reports show that getting people back into jobs in proving more challenging than expected. There are several reasons for this. Some people dpon't want to go abck to work as pandemic fears remain. Others have been constrained by working from home and home schooling. Some people don't find the wages on offer attractive enough to return to the workforce becuase of extended and uprated unemployment benefits. Other may take earlier retirement. Inventories and Backlogs The Institute of Supply Management (ISM) reports are showing a backlog of orders at all time highs and inventories are at an all time low. Companies can't keep pace with demand. Look at the situation they are in with increasing costs for raw materials, delays in the supply chain, pressure to increase wages to attract new employees and demand for higher wages from exiting staff to match current inflation levels., it is highly likely that inflation will be around for a while longer and potentially into the end of this year. Conclusion The Fed's purchases add up to $120 billion a month and have been saying that interest rates wll remain at current levels until 2024. However, if the economy keeps steaming ahead at it's current pace, with inflation running hot, then there is an increasing probability of the Fed bringing this forward. So traders and investors are assessing what the Fed will do next. Will they be forced to change their story and signal to the market that they will start tapering their bond purchases sooner than they thought, ahead of the inevitable rate hikes? That is certainly one possible scenario and the probabilities for this outcome are increasing. Who knew? Did anyone see that coming? Jobs growth of just 266,000 with big downward revisions to the March number from 916,000 to 770,000. Private payrolls rose just 218,000 with manufacturing employment actually falling 18,000 while trade and transport dropped 81,000, retail fell 15,000 and temporary help fell 111,000.
These decreases don't make a whole lot of sense given the strong performance of all these sectors, in terms of activity, over the past couple of months. Construction employment was also flat for the month and this also seems out of kilter given the booming residential construction sector that is more than offsetting weakness elsewhere. However, we did see a boost in leisure and hospitality with an increase of 331,000 reflecting the re-opening and government employment increased 48,000. The poor jobs reports was confirmed by the rising unemployment rate to 6.1% from 6.0% (consensus 5.8%). Its worth noting that the unemployment rate is calculated from another survey (payrolls asks business, unemployment asks households). We saw worker participation rise by 430,000 – people returning to the labour market – while employment rose only 328,000. Does the Fed Know the Score? The US economy has been making good progress since the economic lows of the pandemic last April. 22.4 million people lost their jobs back then. Fast forward to now, and nearly two thirds of that number have found jobs leaving a net loss of 8.2 million. This is a pretty impressive gain over the last year but the jobs reports still shows a clear slow down and the Fed really does want to see a series of strong job reports before considering a change in their policy. It's not all about jobs though as inflation is playing a critical role in this decision and the narrative around 'transitory' inflation might come back to bite them. Essentailly, inflation might be run hotter for longer than they expect and cause them to rethink there stance much sooner. The jury still out on that one. What About Supply Issues? Is the labout market softness more of a supply issue than a demand issue. Possibly. There are many job openings that are not being filled 59% of small businesses reported hiring or trying to hire in April, but 92% of those firms reported few or no qualified applicants. This tells us that there is a huge demand for workers but a lack of supply and this will bea drag on the labout markets for a few months. What is causing the imbalance between supply and demand? Lockdowns and schooling at home have constrained parent's ability to go out and work. In conjunction with extended and uprated unemployment benefits that will continue into September, there is a decreased incentive to go out to work. Silver Linings The US economy is recovering well, even if it is a bit uneven. However, getting all those jobs back will take time. Its a little bit like the stockmarket. It takes the elevator down when it crashes as it did last year at the beginning of the pandemic. Then the markets take the stairs up which they have over the last year or so, with a steady climb to new all time highs.
Increasing Sentiment The European Commission’s economic sentiment indicator increased to 110.3 points in April from 100.9 in March. This number came in well above the consensus forecast which was 102.2. In fact, in two months, sentiment has gained 16.9 points, and it now firmly above its long-term average. Amongst the larger member states, all countries have seen higher sentiment figures, with the Netherlands gaining 10.7 points, Spain 9.1, France 8.5, Germany 5.7 and Italy 5.3. Strength in Numbers There was another surprise as sentiment in the service sector increased by 11.7 points. Industrial confidence is now at a record high, while Confidence in retail and in construction also saw a significant increase. Consumer confidence also improved. The fact that all forward-looking indicators are rising, bodes well for the economy. Production expectations in industry reached their best reading on record, while stocks are considered to be scarce supply. This is at the same time as increasing demand expectations across all sectors.
Once again, this bodes well for a recovery in business investment throughout this year. Unemployment expectations are also declining, and this means we’ll see a growing number of consumers planning to purchase big ticket items over the next year.
Inflation Might Not be Transitory Selling price expectations rose for the second month in a row across all surveyed business sectors and close to a record high in industry, but we are also seeing the numbers above their long term average in construction, retail and even the services sector. Consumer price expectations increased only mildly. The big question is how transitory these price increases will be. Will they disappear once some of the supply chains problems are resolved? With strong demand continuing into the second half of the year, it seems unlikely that price tension will fade away quickly. |
AuthorTim the trader Archives
January 2025
Categories |


 RSS Feed