Last week, the API reported a build in crude oil inventories of 3.754 million barrels after analysts had predicted a draw of 1.867 million barrels. Oil prices are heading down on Tuesday as markets looks to the EU for clarity on further energy sanctions against Russia. However, it is looking highly unlikely at this time, that the EU would reach a unanimous agreement to ban the imports of Russian oil and gas.
In addition, U.S. crude oil production is not increasing. In fact, for six weeks in a row, US oil production has stagnated at around at 11.6 million barrels per day. This is still down by 1.5 million barrels per day from pre-pandemic times. Gasoline inventories have seen a draw this week of 626,000 barrels for the week ending March 18, which follows last week's 3.794-million-barrel draw, according to the API report. Distillate stocks had a decrease in inventory of 826,000 barrels for the week, after last week's 888,000 barrel increase and Cushing saw a 646,000-barrel increase this week. Cushing inventories rose to 24 million barrels as of March 11, according to EIA data, which is down from 59.2 million barrels at the start of 2021, and down from 37.3 million barrels at the end of 2021.
0 Comments
European tightness to persist through the winter In recent times, natural gas prices have hit new records on almost a daily basis. TTF has recently broken above EUR70/MWh, which is up around 245% since the start of the year and up from the lows of a little over EUR3.5/MWh in May last year. What are the factors driving this strong rally? First, we need to go back into time to the spring as this is where the foundations were laid for this rally. We had colder than usual weather through April and May in Europe and this led to a late start if the injection season. Typically, the gas injection season starts at the end of March and early April, however, we didn’t see any significant injection until almost mid-May. Second, for most of the year, there has been little incentive to send spot LNG cargoes into Europe, so these cargoes have made their way to Asia instead, where prices have been more attractive. The spot Asian LNG premium over TTF has averaged a little over US$1.50/MMBtu since the start of the year through until the end of August. Although with the more recent rally in European prices, TTF is now trading at a premium to spot Asian LNG. Third, there have been several outages over the summer comprised of a mix of planned and unplanned outages. Russian gas flows fell in July due to maintenance on both the Yamal-Europe and Nord Stream pipeline. While in August flows were disrupted after a fire at one of Gazprom’s condensate treatment plants in Western Siberia. Average Russian flows via the Mallnow entry into Germany were down 40% MoM in August. Although these flows have recovered more recently. Norway has also seen a fair number of outages this summer, including at the Troll field. Another factor to consider is the record carbon prices in Europe which have ensured coal to gas switching. EU carbon allowances have rallied as much as 93% this year. Although, the more recent strength in gas prices has reversed this advantage. Dark spreads are more attractive than spark spreads over 4Q21. There have even been some coal plants reopening in the UK. Looking at the big picture, we have a combination of demand recovery across Europe, lower inflows and falling production which means that that European gas inventories are well below average. Storage is only 71% full, compared to the 5 year average of more than 86%. Storage is at its lowest levels in at least a decade going into winter. With the official start of heating season quickly approaching, it is quite likely to see prices at elevated levels into winter as well as increased volatility. In conjunction with this, we see that the forward curve in Europe basically flat until February, so there is little incentive to store gas. To see an incentive to store gas, the forward curve would need to shift to contango, and this scenario seems unlikely given the current tightness.
Another supportive factor for LNG is China making a focused effort to tackle emissions this year. In addition, the significant rally in coal prices in China this year, due to a combination of import restrictions and the temporary closure of some coal mines earlier in the year, is providing support to LNG. It is unlikely that Chinese demand for LNG will slow in coming months as the government will want to ensure adequate supply particularly over the winter months.
High Global Prices Provide a Boost to US LNG Exporters Strong prices in Europe and Asia would be welcome news to US LNG exporters, particularly after the weakness seen last year, which led to a significant amount of cargo cancellations. However, this year there has been little risk of that with the spot Asian LNG premium over Henry Hub averaging almost US$8/MMBtu so far this year. While the spread is currently closer to US$14/MMBtu. As a result of this, US LNG exports have hit record levels this year. US LNG exports over the first six months of the year are up 41% YoY, while exports in March hit a monthly record high of 321Bcf. In addition to stronger LNG exports, pipeline exports have also hit record levels with increased flows to Mexico. Domestic demand in the US has also been strong. The latest available EIA data shows that demand from power generators in June increased by 3.5% YoY, and almost 9% higher than the same month in 2019. Stronger export volumes and strong domestic demand has meant that US inventory injections this year have been slower than usual. The tighter environment going into winter suggests that Henry Hub will likely remain well supported over the coming months.
Earlier in March, the UK government said it would phase out imports of Russian oil, which account for about 8 percent of its total imports, by the end of 2022. So Johnson has been out looking for alternative supplies and this week, has visited Saudi Arabia and the United Arab Emirates in seach of those supplies. However, his trip was to no avail and he left empty handed. Venezuela is also on the list with promises of sanction relief in exchange for oil derivatives.
The EU are taking a more cautious approach to oil and gas sanctions because it is much more heavily reliant on Russian fossil fuels. Russia supplies about 40 percent of the EU’s imported gas and 25% of its crude oil. If the EU decided to change to a firmer stance on sanctions, the UK economy would take a hit on the economy of between $92 and $98.7 billion (70-75 billion pounds), Chancellor Rishi Sunak told ministers. This is equal to 3 percent of the UK’s GDP. According to the European Central Bank, a decrease of 10 percent in gas supplies to Europe would translate into a 0.7-percent GDP decreaes. So instead of a complete ban on Russian oil and gas imports, the EU will now look to decrease its imports of Russian gas specifically by two-thirds within a year. The bottom line is that the UK and EU need to find significant supplies of oil and gas from elsewhere and this transition is highly likely to cause volatility in the markets and pain for consumers.
Oil prices were trading down sharply on Tuesday, continuing Monday's selloff. In conjunction with this, China locked down millions of its residents in some of its largest cities which has a huge potential imapct for oil demand.
U.S. crude oil production has remained at the same levels for five weeks in a row, at 11.6 million barrels per day for the week ending March 4. This is down 1.5 million barrels per day from before the pandemic. The API also reported a draw in gasoline inventories at 3.794 million barrels for the week ending March 11, following the previous week's 1.988-million-barrel draw. Distillate stocks saw an increase in inventory of 888,000 million barrels for the week, after last week's 5.485-million barrel decrease. Cushing saw a 2.308 million-barrel increase this week. Cushing inventories declined to 22.2 million barrels as of March 4, down from 59.2 million barrels at the start of 2021, and down from 37.3 million barrels at the end of 2021.
It also keeps the door open for a rate hike before year-end, particularly given the current high levels of uncertainty. The bank confirmed the end of its Pandemic Emergency Purchase Programme (PEPP) by the end of March and also confirmed the previously announced increase in the Asset Purchase Programme (APP) to €40bn per month from the current €20bn. In May, the APP purchases will be reduced to €30bn and in June to €20bn.
Compared with changes to its monetary policy in December, this announcement carries a more hawkish tone. With this announcement, the ECB have brought forward the €20bn per month purchases by four months. So what has caused this change in monetary policy? One reason could be the spectre of stagflation that is lurking in the shadows. The war in Ukraine seriously increases the risk of stagflation coming out of the shadows in the eurozone. As a result of the war, we've seen a lot of factors thrown in to the economic melting pot, such as extremely high energy and commodity prices, potential energy supply disruptions, supply chain disruptions, weaker trade conditions and a high degree of uncertainty for both companies and consumers. This has changed the eurozone’s economic prospects in recent days and weeks. In summary, today's announcement shows a cautious approach to normalisation of monetary policy. However, this still leaves the possibility of a first rate hike before the end of the year. Watch this space as we hear more from the ECB.
The USDA revised down global soybean production by 8.7mt, with major downgrades coming from Brazil (-5mt), Argentina (-1.5mt) and Paraguay (-1.8mt). This follows on from the USDA having already lowered its global production estimate by around 9.2mt last month. Taking into account the latest downgrade, the USDA has cumulatively lowered global soybean production estimates by around 21.3mt over the past 4 months. Its no surprise then, that prices have been increasing significantly over the last 4 months. Indeed, after the WASDE report, CBOT soybean futures above $16 per bushel for the first time since last June. The USDA now forecasts global soybean production to total around 363.9mt in 2021/22, which is down from 366.2mt in 2020/21. Global soybean demand estimates were also revised down by around 5.8mt to 369.2mt, due to softer demand from China (-3mt), as higher prices are starting to bite into consumption. As a result of the latest changes, the USDA lowered its ending stocks estimate for 2021/22 by 2.4mt to 92.8mt. The market was expecting a greater revision, with expectations of ending stocks around 91mt. For the US market, the USDA also revised down soybean inventory estimates by 25m bushels to 325m bushels, due to stronger demand. Healthy demand for soybean oil has pushed up soybean crushing in the domestic market, with domestic consumption estimates revised up from 2.31b bushels to 2.33b bushels. Domestic production and export estimates were left unchanged at around 4.44b bushels and 2.05b bushels respectively. 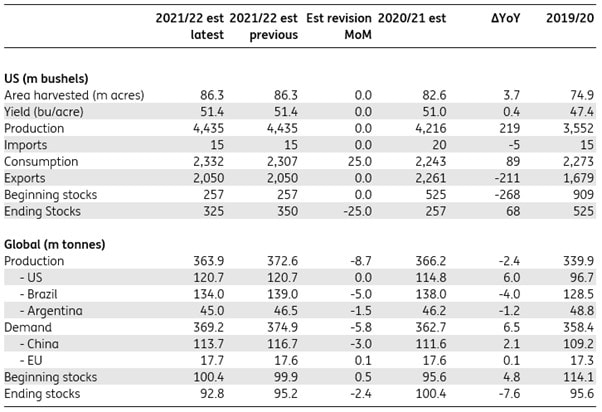 Soybeans supply/demand balance
Source: USDA
Corn Updates The USDA revised revised down global production estimates by around 1.6mt, primarily becuase of weaker supply prospects from Brazil where production was revised down by around 1mt. Global demand for corn was revised down by around 0.9mt. As a result, global corn ending stocks for 2021/22 were revised down by around 0.8mt to 302.2mt. The market was looking for a number closer to 300mt. These revisions were less than what the market was expecting, but nevertheless, the global market is still looking marginally tighter than it was last month. 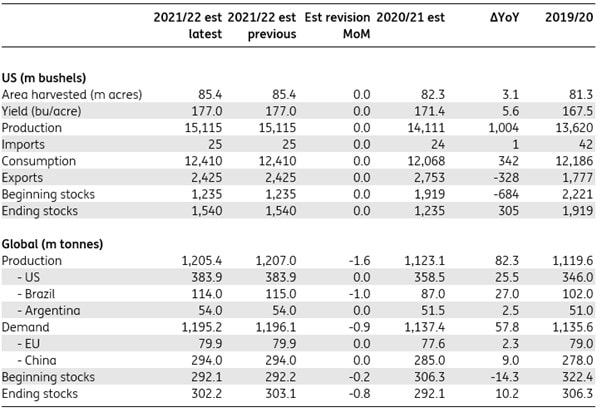 Corn supply/demand balance Source: USDA Wheat Updates The USDA tightened its global wheat balance marginally. Ending stocks for 2021/22 were lowered by 1.7mt to 278.2mt. This revision lower comes despite an increase in beginning stocks by around 1.1mt. Global wheat production estimates fell by 2.2mt to 776.4mt, with major downgrades seen from the Middle East due to dry weather. Global demand for wheat increased by 0.6mt to 788.1mt, on higher feed and residual demand mainly from Canada. US wheat ending stocks for 2021/22 were revised higher by 20m bushels to 648m bushels, due to weaker consumption and exports. Export estimates were lowered by around 15m bushels to 810m bushels, on slower export sales and shipments. 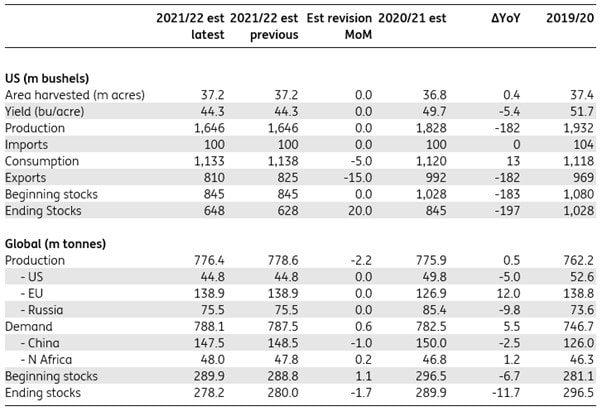 Wheat supply/demand balance
Source: USDA
The European wind and solar markets are expected to provide solid growth of 8% and 12%, respectively, in 2022, in terms of additional capacity. The majority of this growth is from large scale solar plants. (14%) but small scale rooftop solar is set to grow by 11%. The majority of growth in the wind market is in the offshore market (16%) as some large offshore wind parks will come online in 2022. The onshore wind market is seeing steady growth of 7%. This is all good news but what does this look like in terms of addional capacity? The onshore wind sector will add the most capacity at 14 GW with small-scale solar projects adding 12 GW. Thhe offshore wind sector will add 4 GW of capacity in 2022. This is a relatively small addition compared to other segments, but policymakers in the Nordics, UK, Ireland, Germany and the Netherlands are working on special planning for offshore wind farms and grid infrastructure. Watch this space as there will alot of progress and investment over the next few years.
To meet these climate goals, the focus has been on phasing out coal and nuclear-fired power plants, reducing European oil and gas production and increasing power generation from wind turbines and solar panels. This focus is all about the sustainability aspects of energy systems. The outcome of this is that the supply side of energy system is being reformed at a faster rate than the demand side. What does this mean? It means that Europe has to rely on energy suppliers outsideof the EU and depends on imports of natural gas from Russia and Norway and liquefied neatural gas (LNG) from the US and Quatar. What if those supplies dried up for some reason? What if the tap was turned off? Being so dependant on external energy supplies makes Europe's energy security vulnerable. This is a problem and not an easy one to fix in the short term. The Three Main Pillars of Energy Systems
What factors could impact the reliabilty of energy systems? There could be long, severe winters, bankruptcies of energy providers, geopolitical tensions, wars, natural disasters and so on. In addition to this, we have to deal with the affordability of energy. Affordability decreases as energy prices on fossil fuels continue their march higher. Increasing demand and decreasing supply or supply disruptions will add impetus to higher prices. Perhaps if the focus was not so much on sustainabilty but a little bit more balanced with reliability and affordability, we'd be in a much better place.
There is certainly a need to develop more green energy alternatives in Europe, but this will take time, and as we can see, wind and solar power are experiencing strong growth, but is it enough to offset the reduction in fossil fuel production across the continent? If not, the result is an increasing depenance on external energy suppliers which just exacerbates the energy crisis and those three energy pillars just get more out of balance. What is required is well-balanced and coordinated energy transition plans from member states to resolve these challenges. Phasing out coal and nuclear power needs to be coordinated with an increase in renewable energy systems, that enables a reduction in the dependance on external providers that will ultimately lead to increased energy security. Its easy to say but anything but easy in the real world unless there are is catalyst for action. All too often, it is only when we stand at the precipice and look into the abys, that we are forced to take action. It doesn't have to be that way though! It is time to re-balance the pillars of energy systems.
Indeed, the Feb have dropped the idea of transitory inflation and they are doubling the pace of the taper to conclude buying by March. Will the Fed hike rates in Q1 2022? However, teh Bank of England have beaten them to it and have surprised markets for a second time, this time by hiking its key interest rate with the latest strong inflation reading tipping the balance in favour of the increase. They will also start reducing their balance sheet after the next rate hike. But when will that be? Who knows! The BoE has been unpredictable recently.
The European Central Bank has been the most cautious of the central banks, which is fairly typical as they are watching the weaker links within the monetary union. Despite inflation forecasts having been revised sharply upwards, 2023 and 2024 are seen now at 1.8%, not far below the ECB’s target, with risks tilted to the upside. Concessions have been made to ensure a smooth transition. The Pandemic Emergency Purchase Programme's net purchases will end after March 2022 and the Asset Purchase Programme will be doubled after March, but then gradually reduced each quarter until back at €20bn per month in 4Q 2022. In light of the BoE and Fed decisions, this was a dovish package, especially taking the inflation backdrop into consideration. While the guidance makes a rate hike in 2022 less likely, what happens early in 2023 is very much open for debate. In addition, the restarting of PEPP net purchases is still a decision that the governing council has to take.
A number of countries have imposed restrictions on flights from parts of Southern Africa, while Israel has shut its borders completely. Given that these restrictions will have the most impact on air travel at the moment, it is no surprise that jet fuel cracks also came under significant pressure. There is also a lack of information on the latest variant and whether is is a significant threat so it is possible that the sell-off on Friday is overdone. Initial reports suggest that symptoms from the Omicron variant are mild, but there are still questions around how effective current vaccines will be against this latest variant. OPEC+ Meeting
Since the initial nreakout of COVID, OPEC+ has taken a cautious approach so they may continue with is approach moving forward. At it's last meeting, they agreed to increase output by 400 million barrels per day in December, so any decision made this week will probably be for January production levels, but given the SPR releases, will they pause furhter supply increases to offset the SPR releases? OPEC’s Economic Commission Board warned that the global oil market could see large surpluses due to these releases, particularly over the early part of next year.
Crude Inventories The latest weekly data from the EIA shows that commercial US crude oil inventories increased by 1.02 MMbbls over the last week, while Cushing crude oil inventories increased by 787Mbbls. The increase in commercial inventories was driven by a 245Mbbls/d increase in crude oil imports over the week, whilst oil exports also fell by a significant 1.02MMbbls/d. On the product side, gasoline and distillate fuel oil inventories declined by 603Mbbls and 1.97MMbbls respectively. Implied demand for refined products also edged higher over the week. Overall, the report from the EIA was fairly neutral. |
AuthorTim the trader Archives
January 2025
Categories |


 RSS Feed